Case Studies

Travelr is a concept for a site that allows people to learn about a city from the people who actually live there.
Background
It is estimated the 15.3 million American households move each year. Approximately 3 million of them move to another state. Moving to another city is a major life change that requires planning and searching for information about the new city. The vast majority of Americans who move are aged 18-34
Research Goals
Find out what information about a new city is the most pressing and important to the users with a focus on younger adults aged 18-34. Determine what challenges and issues people face when moving and adjusting to a new city. What resources would these people find the most useful?
The Problem
What’s the issue that this website will resolve?
How might we make it easier for people to find a city that fits their needs and desires?
How can people learn what it’s like to live in a city before they move there?
How can people ensure that they are getting accurate information about a city?
Interviews
Age: 28-37 Genders: 66% Male 34% Female
Interviews conducted remotely
The purpose of these interviews was to find information on why people relocate to different cities, how they decide which cities to move to, and what attributes they find most important about each city.
Interview participants were asked about:
Reasons for past moves
Information to look for about a city
Information you wish you had known
Favorite aspects of past cities
Biggest surprise when moving to a new city
Describing a “dream city”
Future plans to move
How could an app have helped you?
Affinity Map
Mapping out the answers and responses of interview participants
Reasons to Move
Work/Employment
Family/Spouse
School/College
Findings
This is the information that was acquired from the interviews. The following were the most common answers given by the interviewees
Best City Attributes
Cost of Living/Employment Opportunities
Proximity to Nature/Water
Weather
Walkability/Public Transport/Traffic
Population Stats
Activities/Social Scene
Crime/Safety
Population Stats (age, demos, income, etc.)
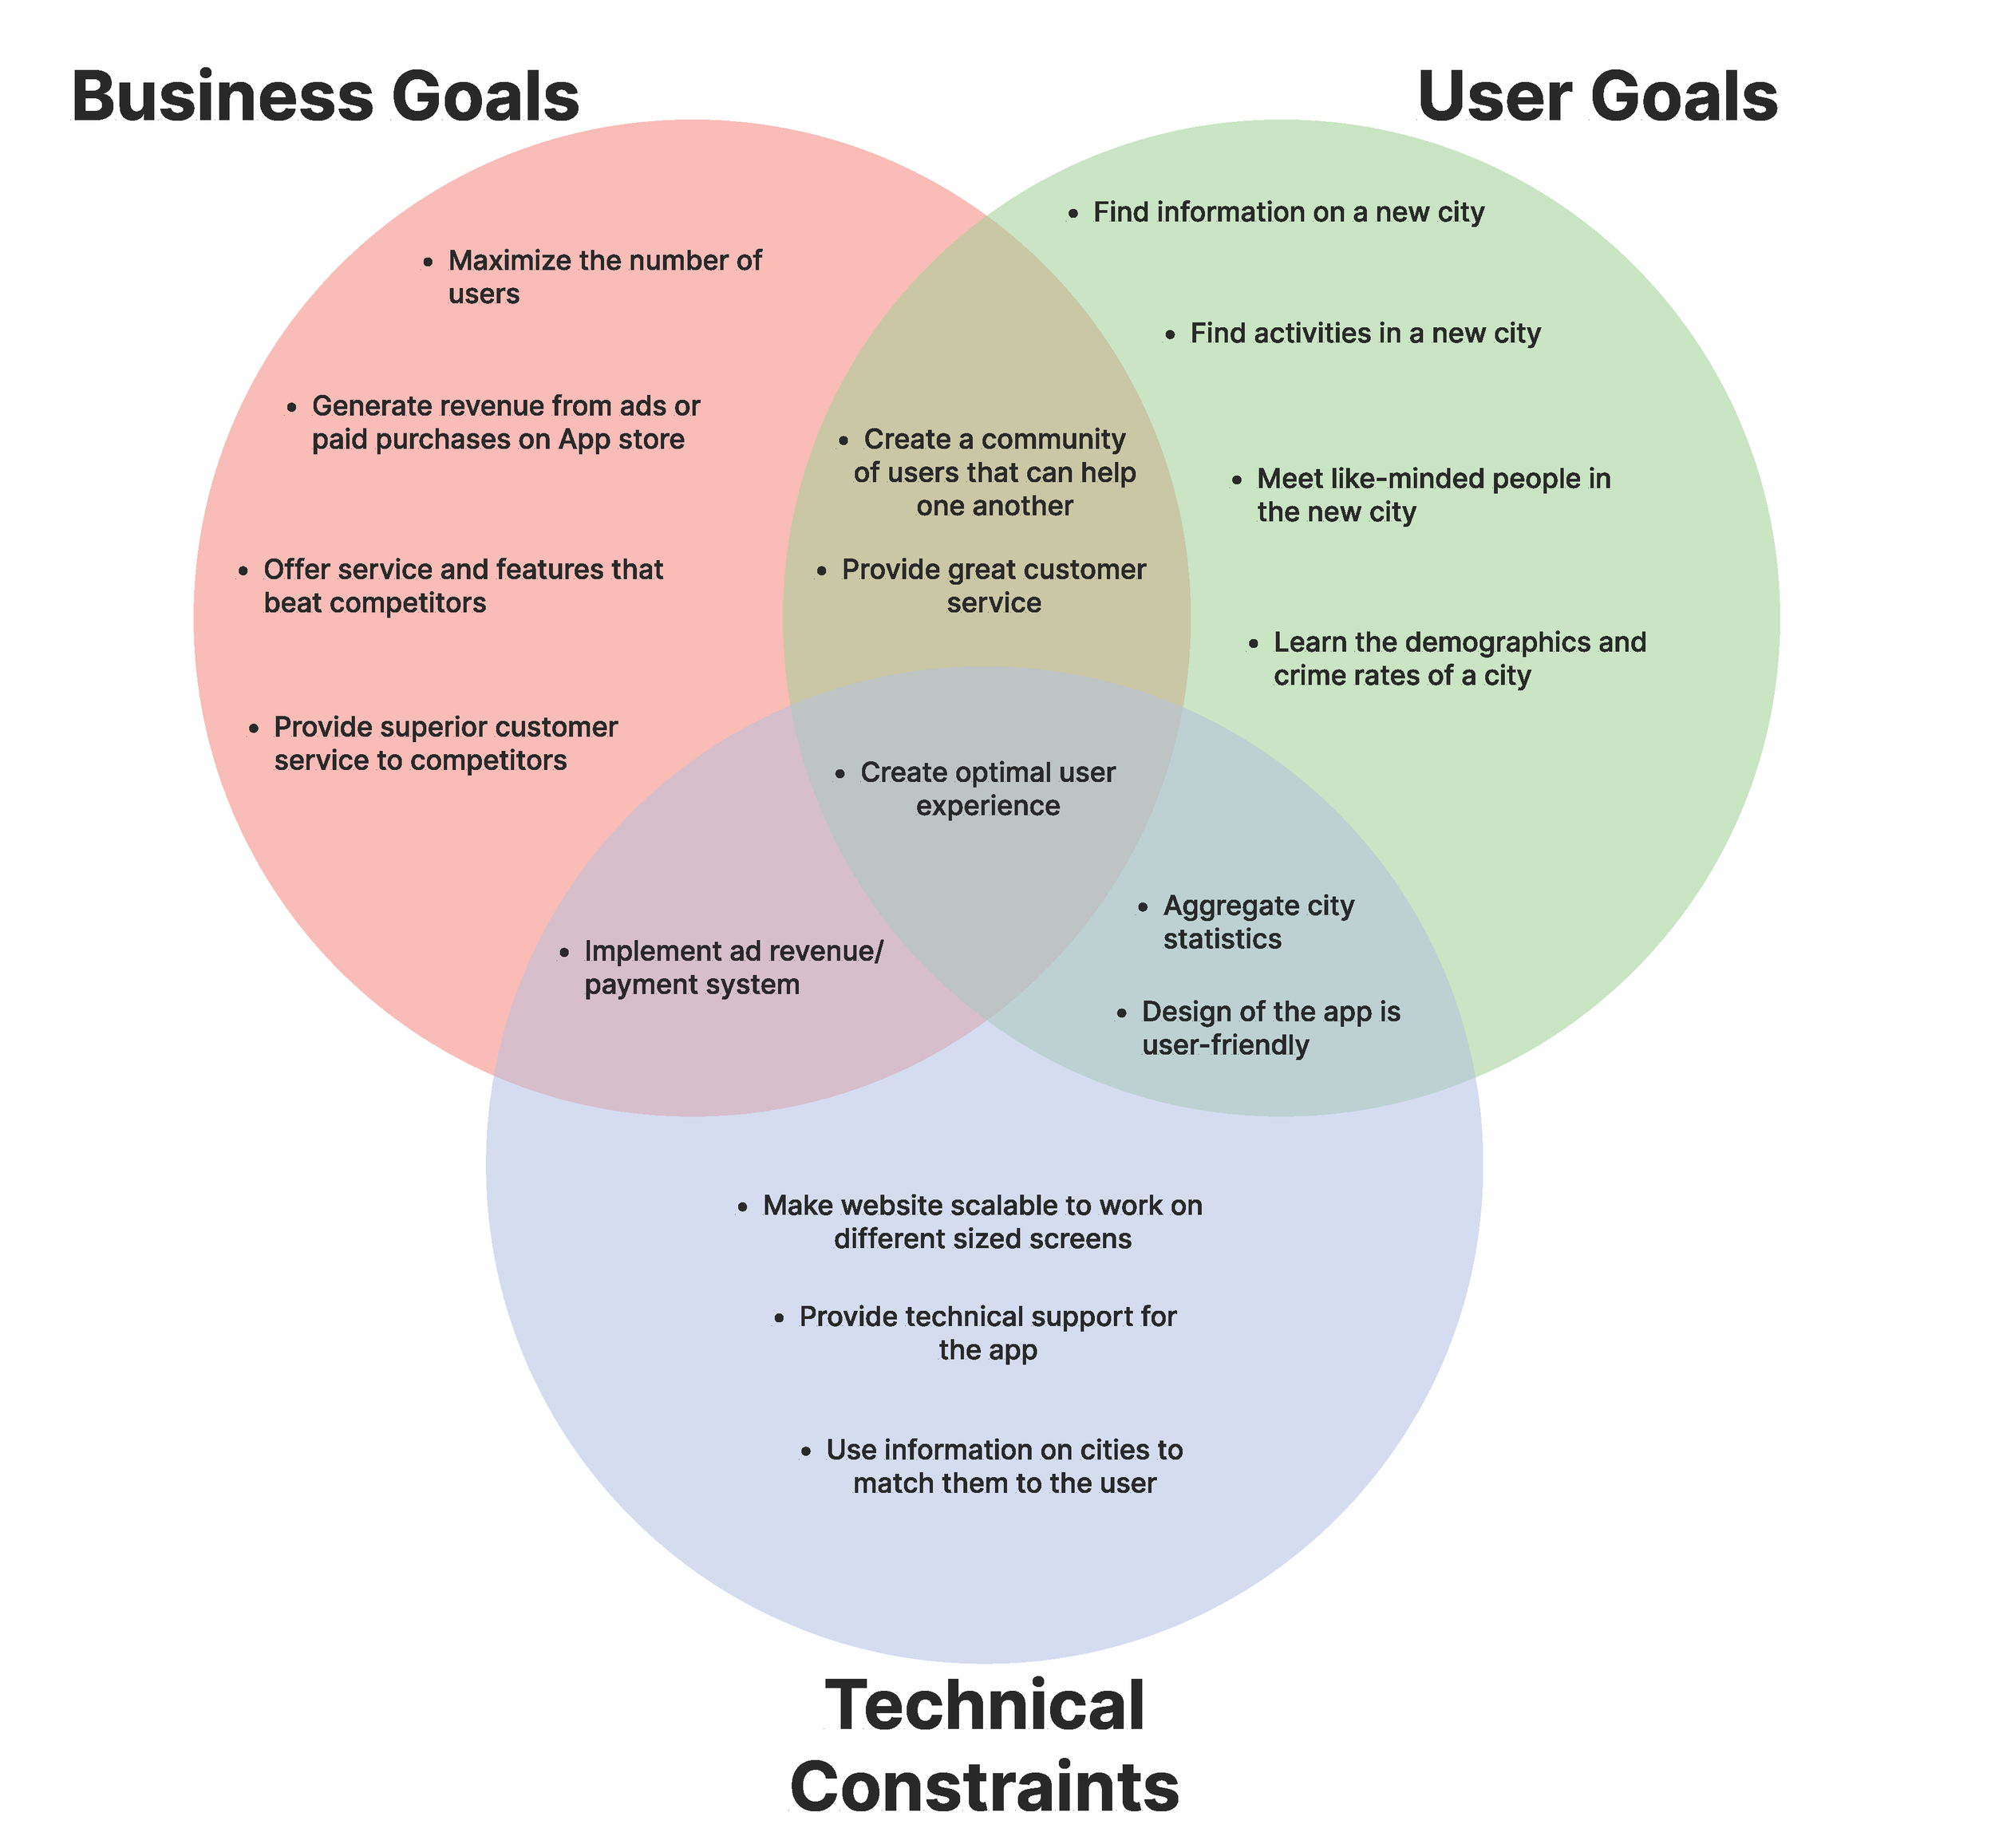
Project Goals
What does this website needs to accomplish for the company and users?
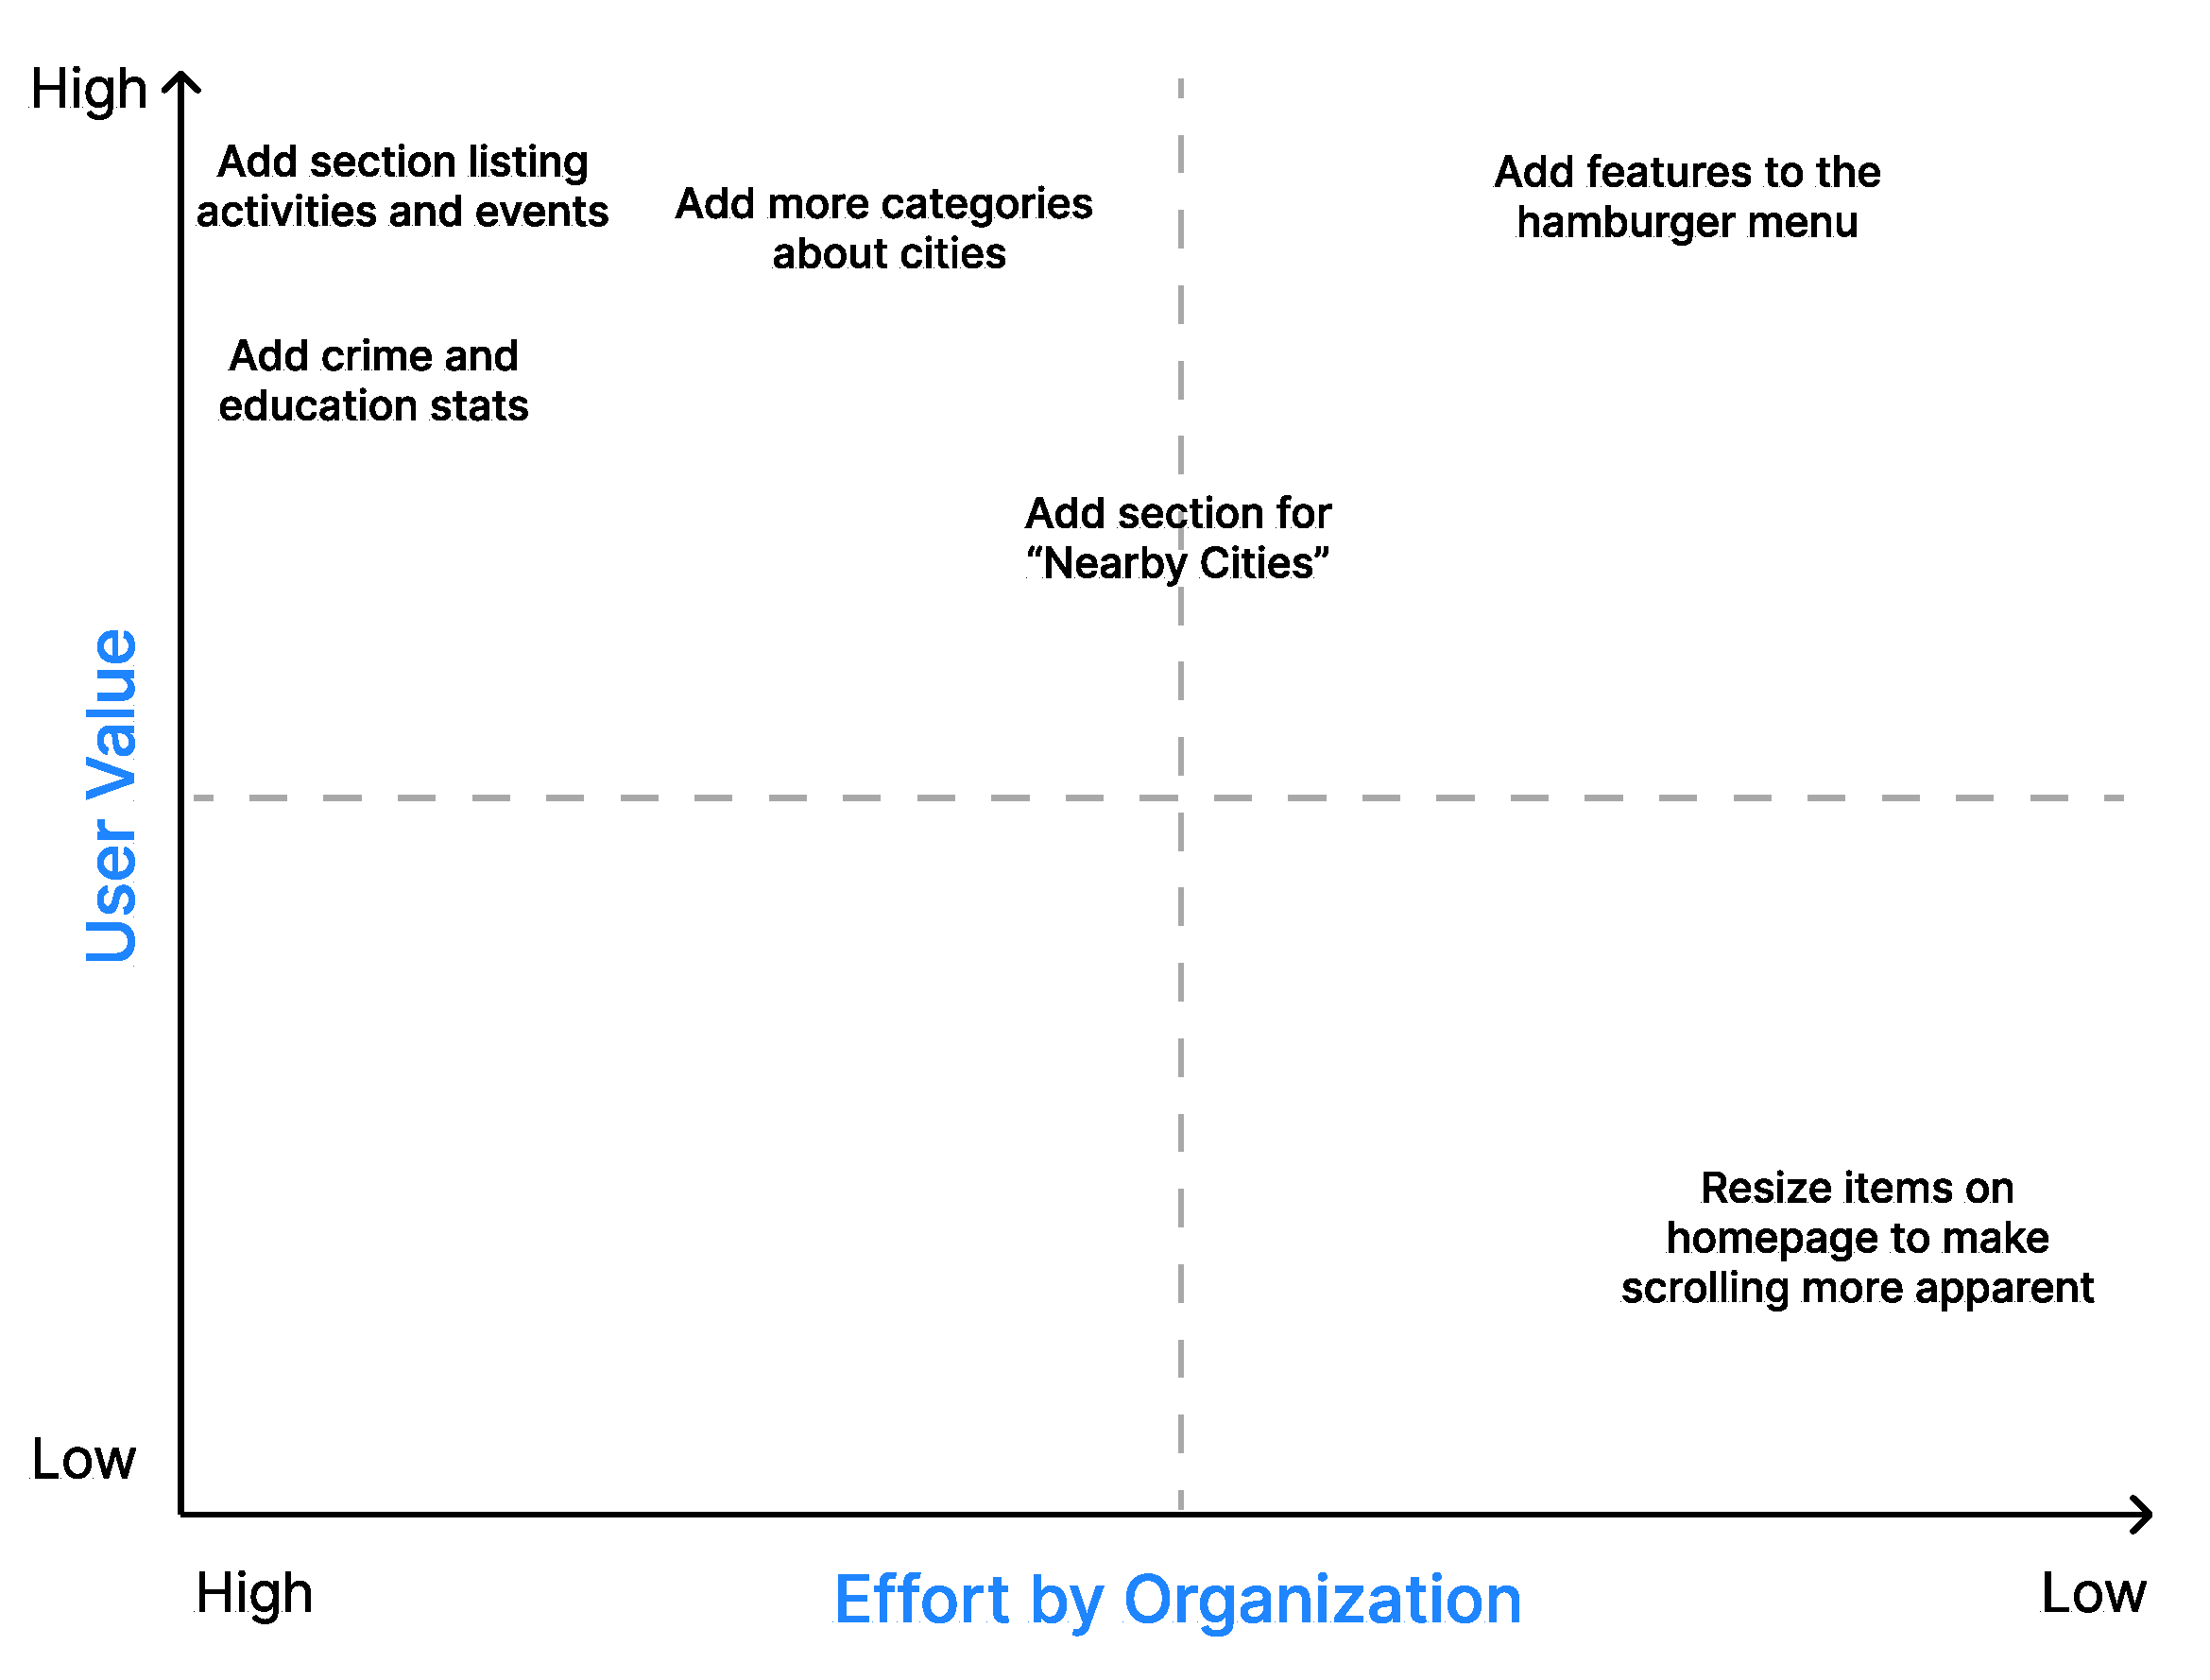
Feature Matrix
Which features are most valuable compared to how much effort is needed to implement them?
Personas
What type of user is this website made for?


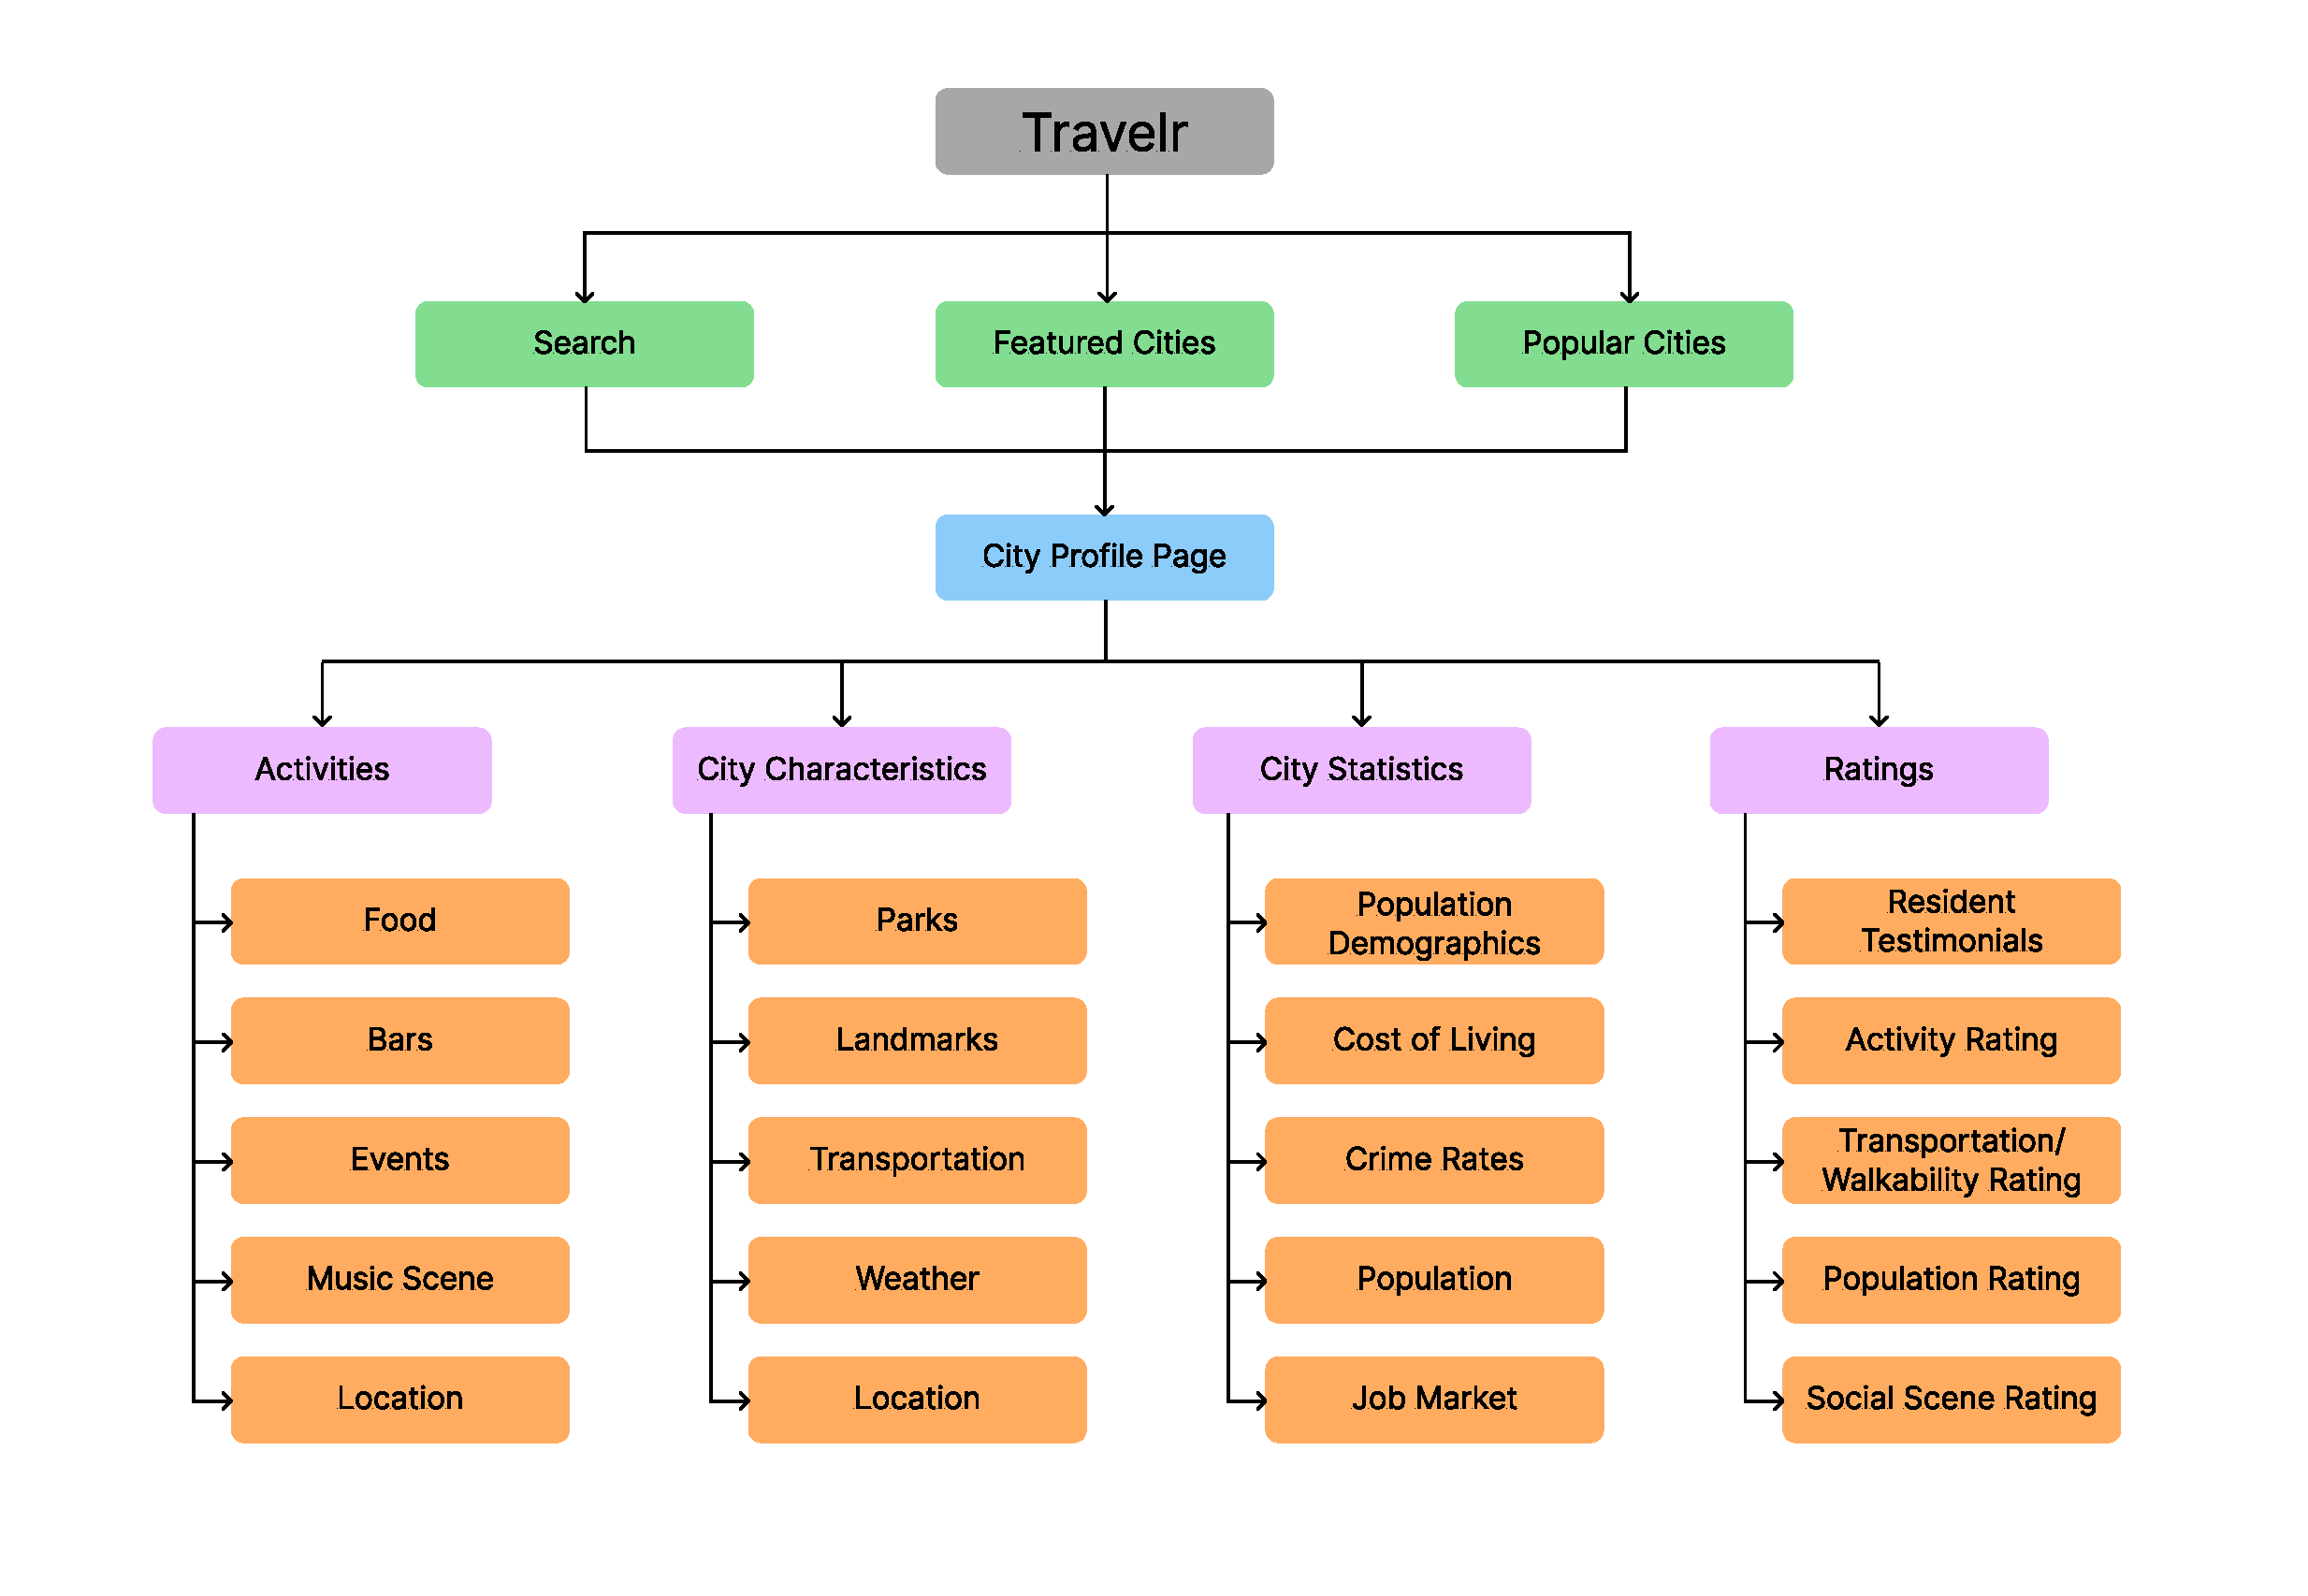
Site Map
The navigational layout of the website
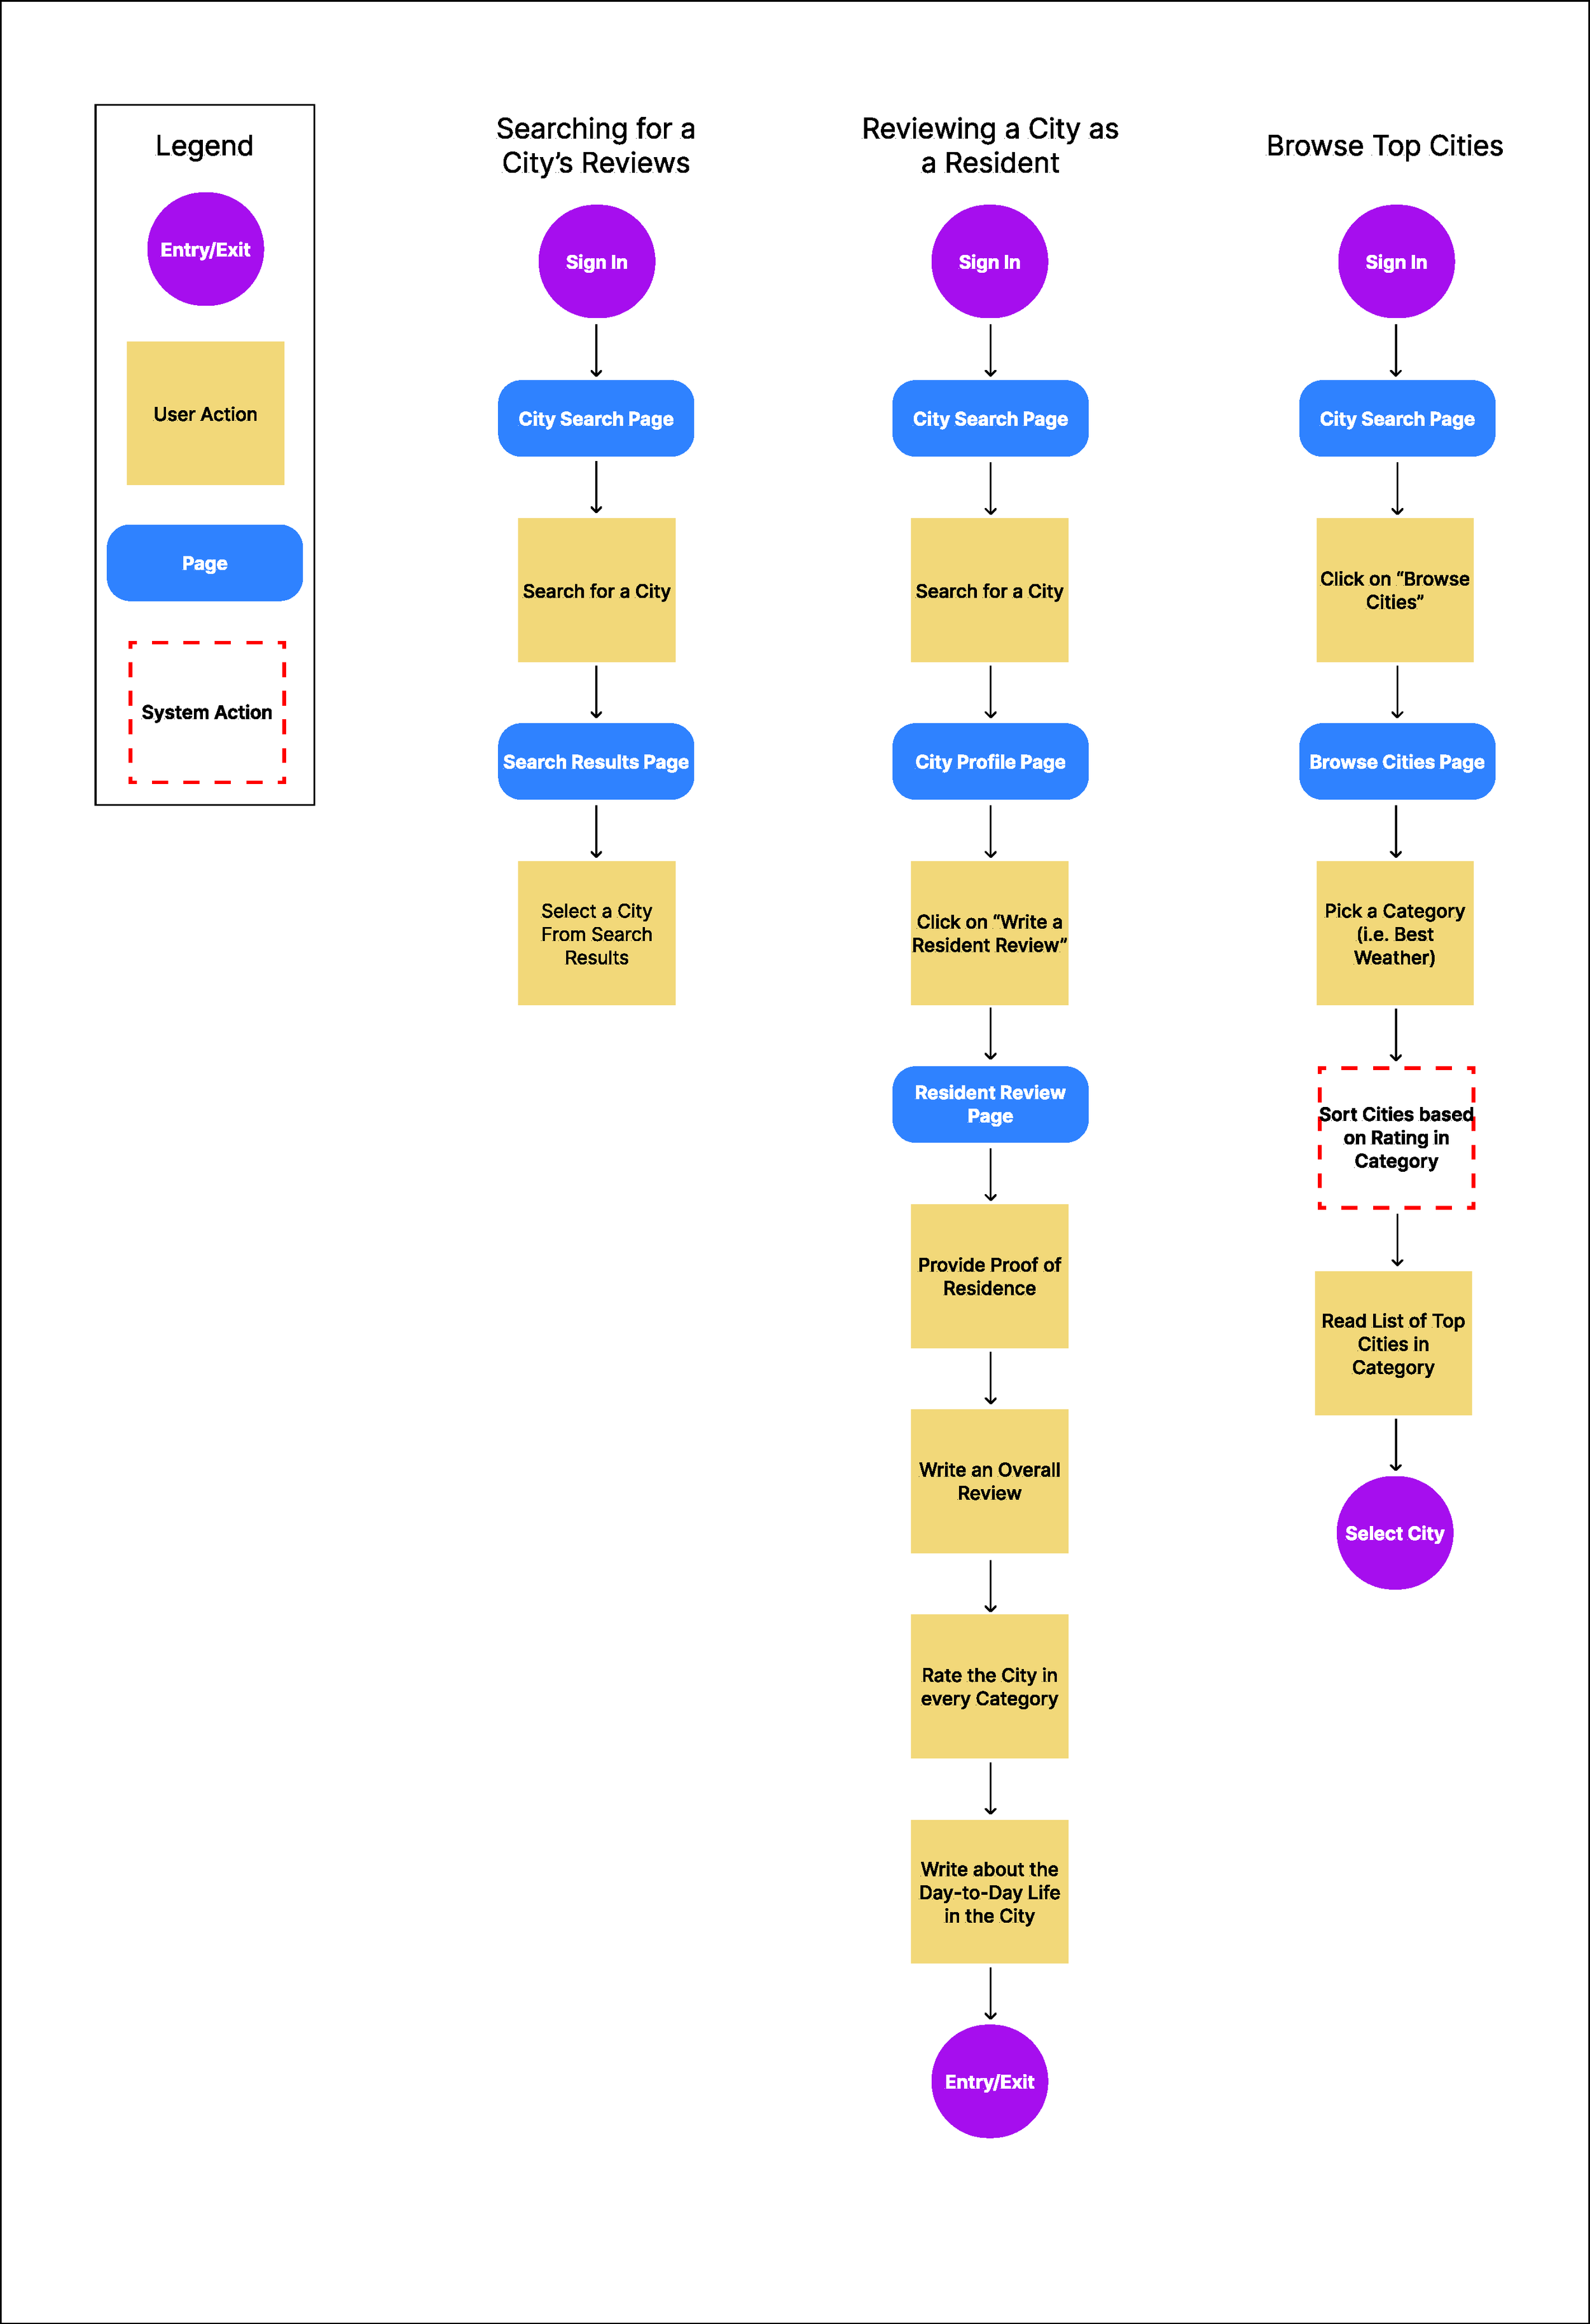
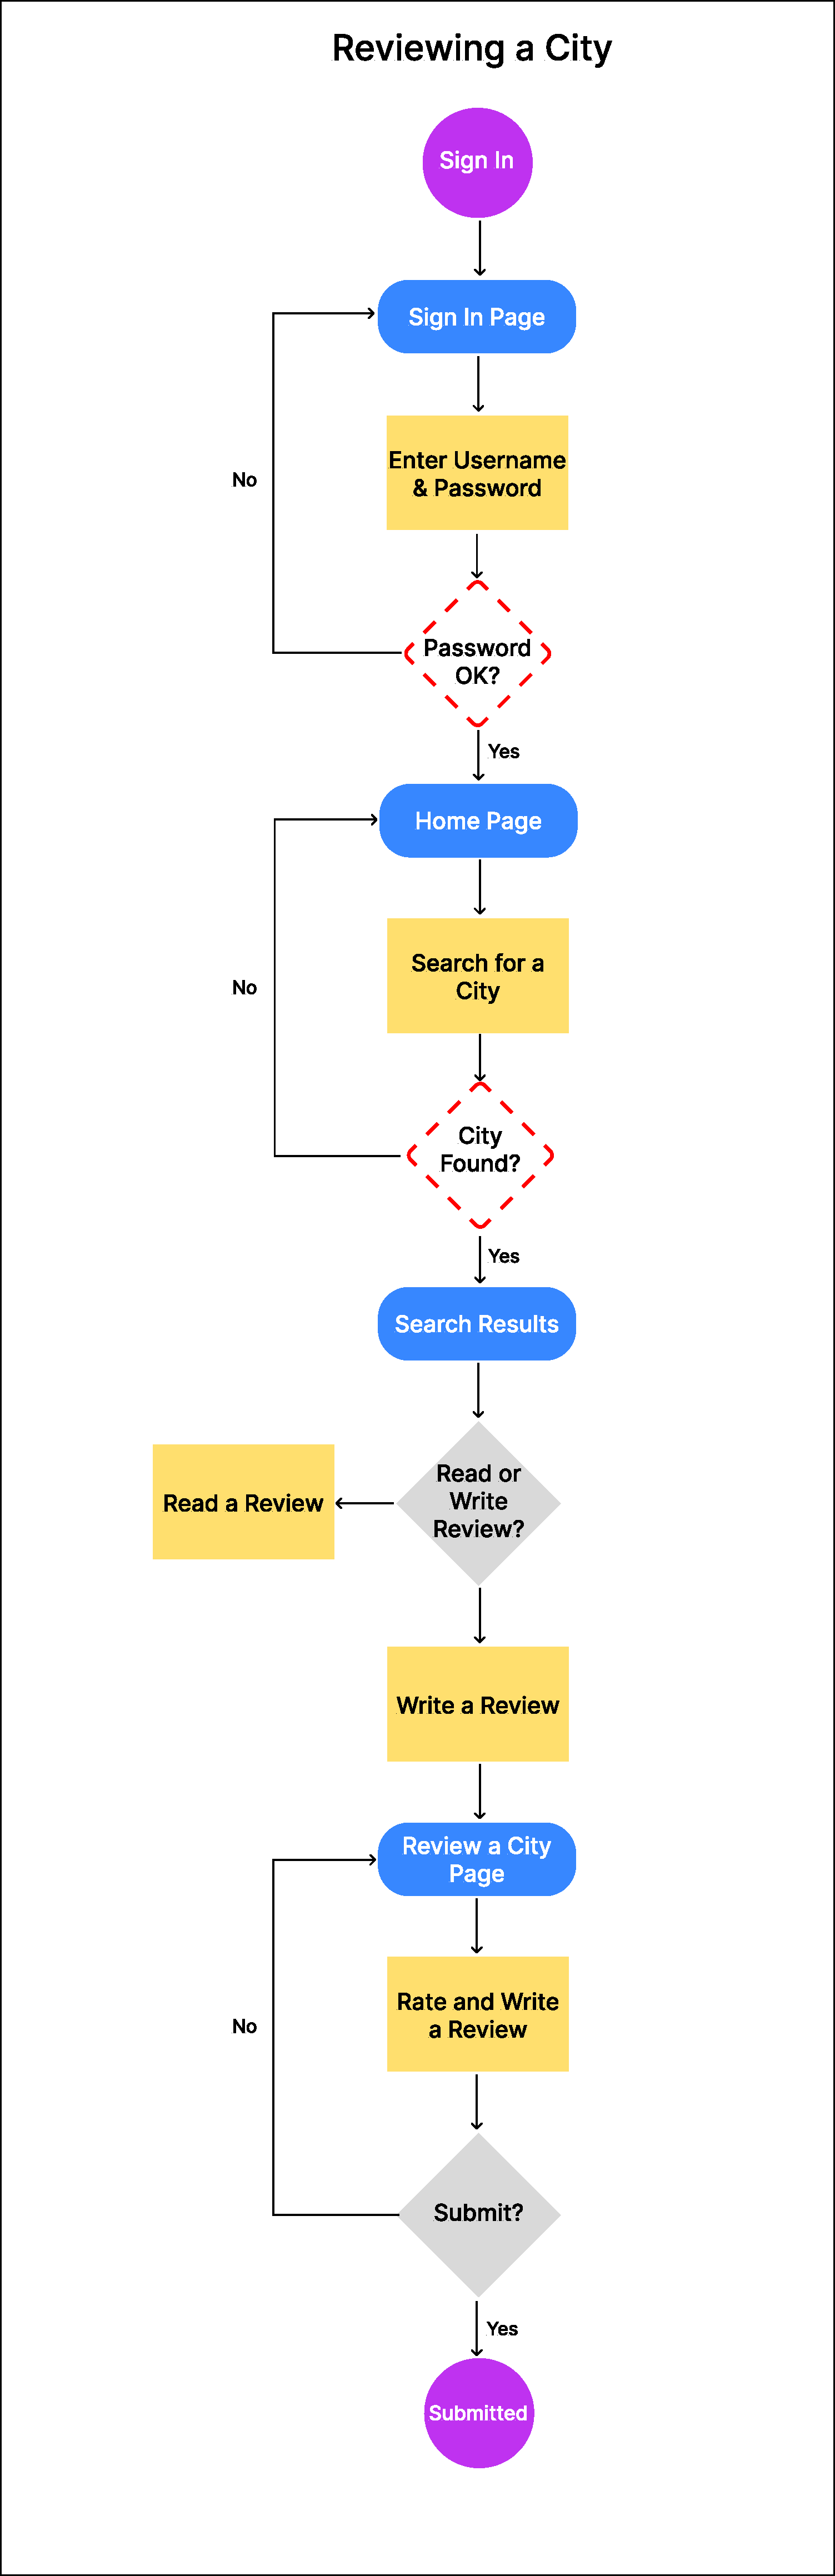
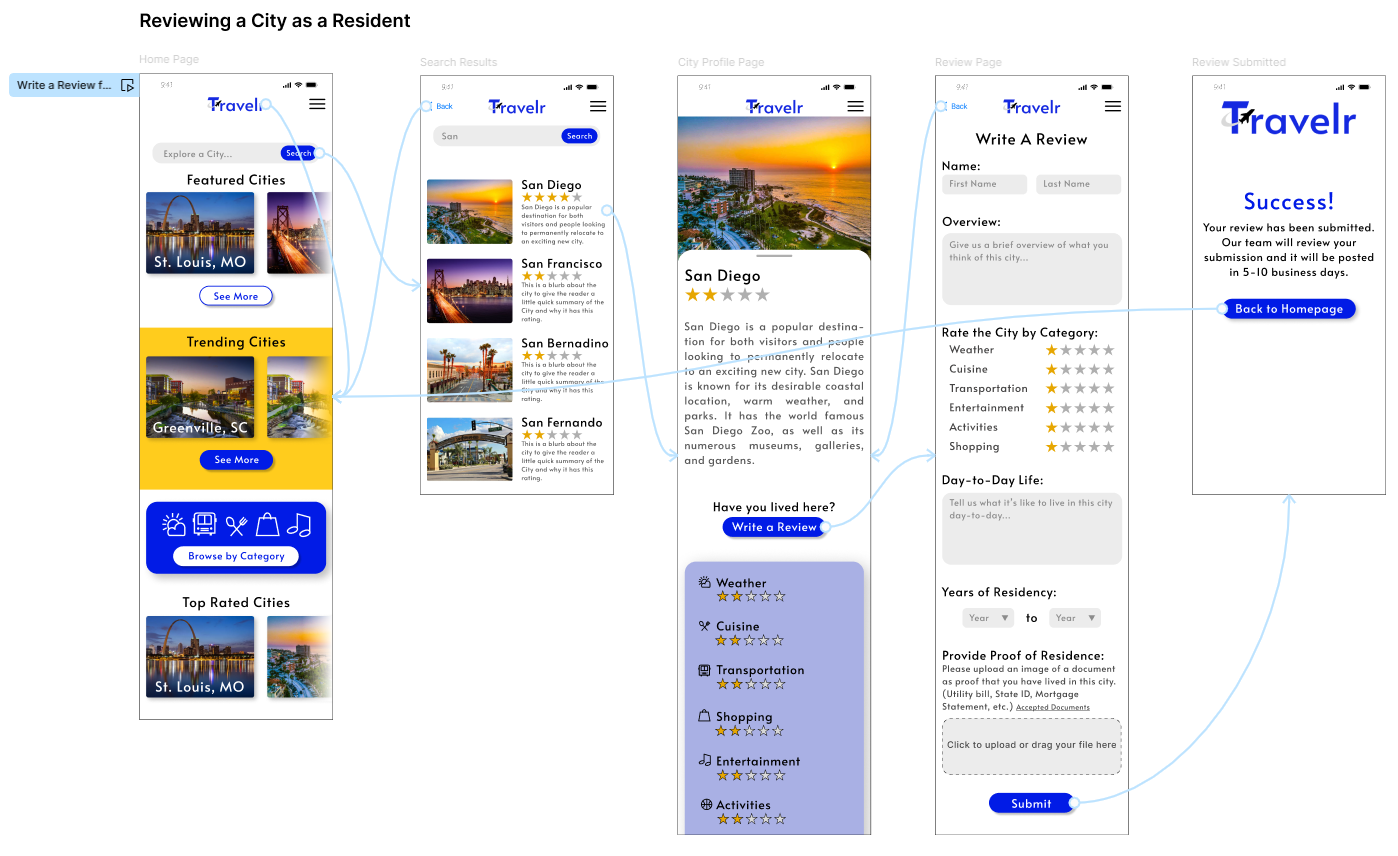
User & Task Flows
That paths taken by users to accomplish tasks on the site
Mobile Wireframes
Low fidelity drafts of the site
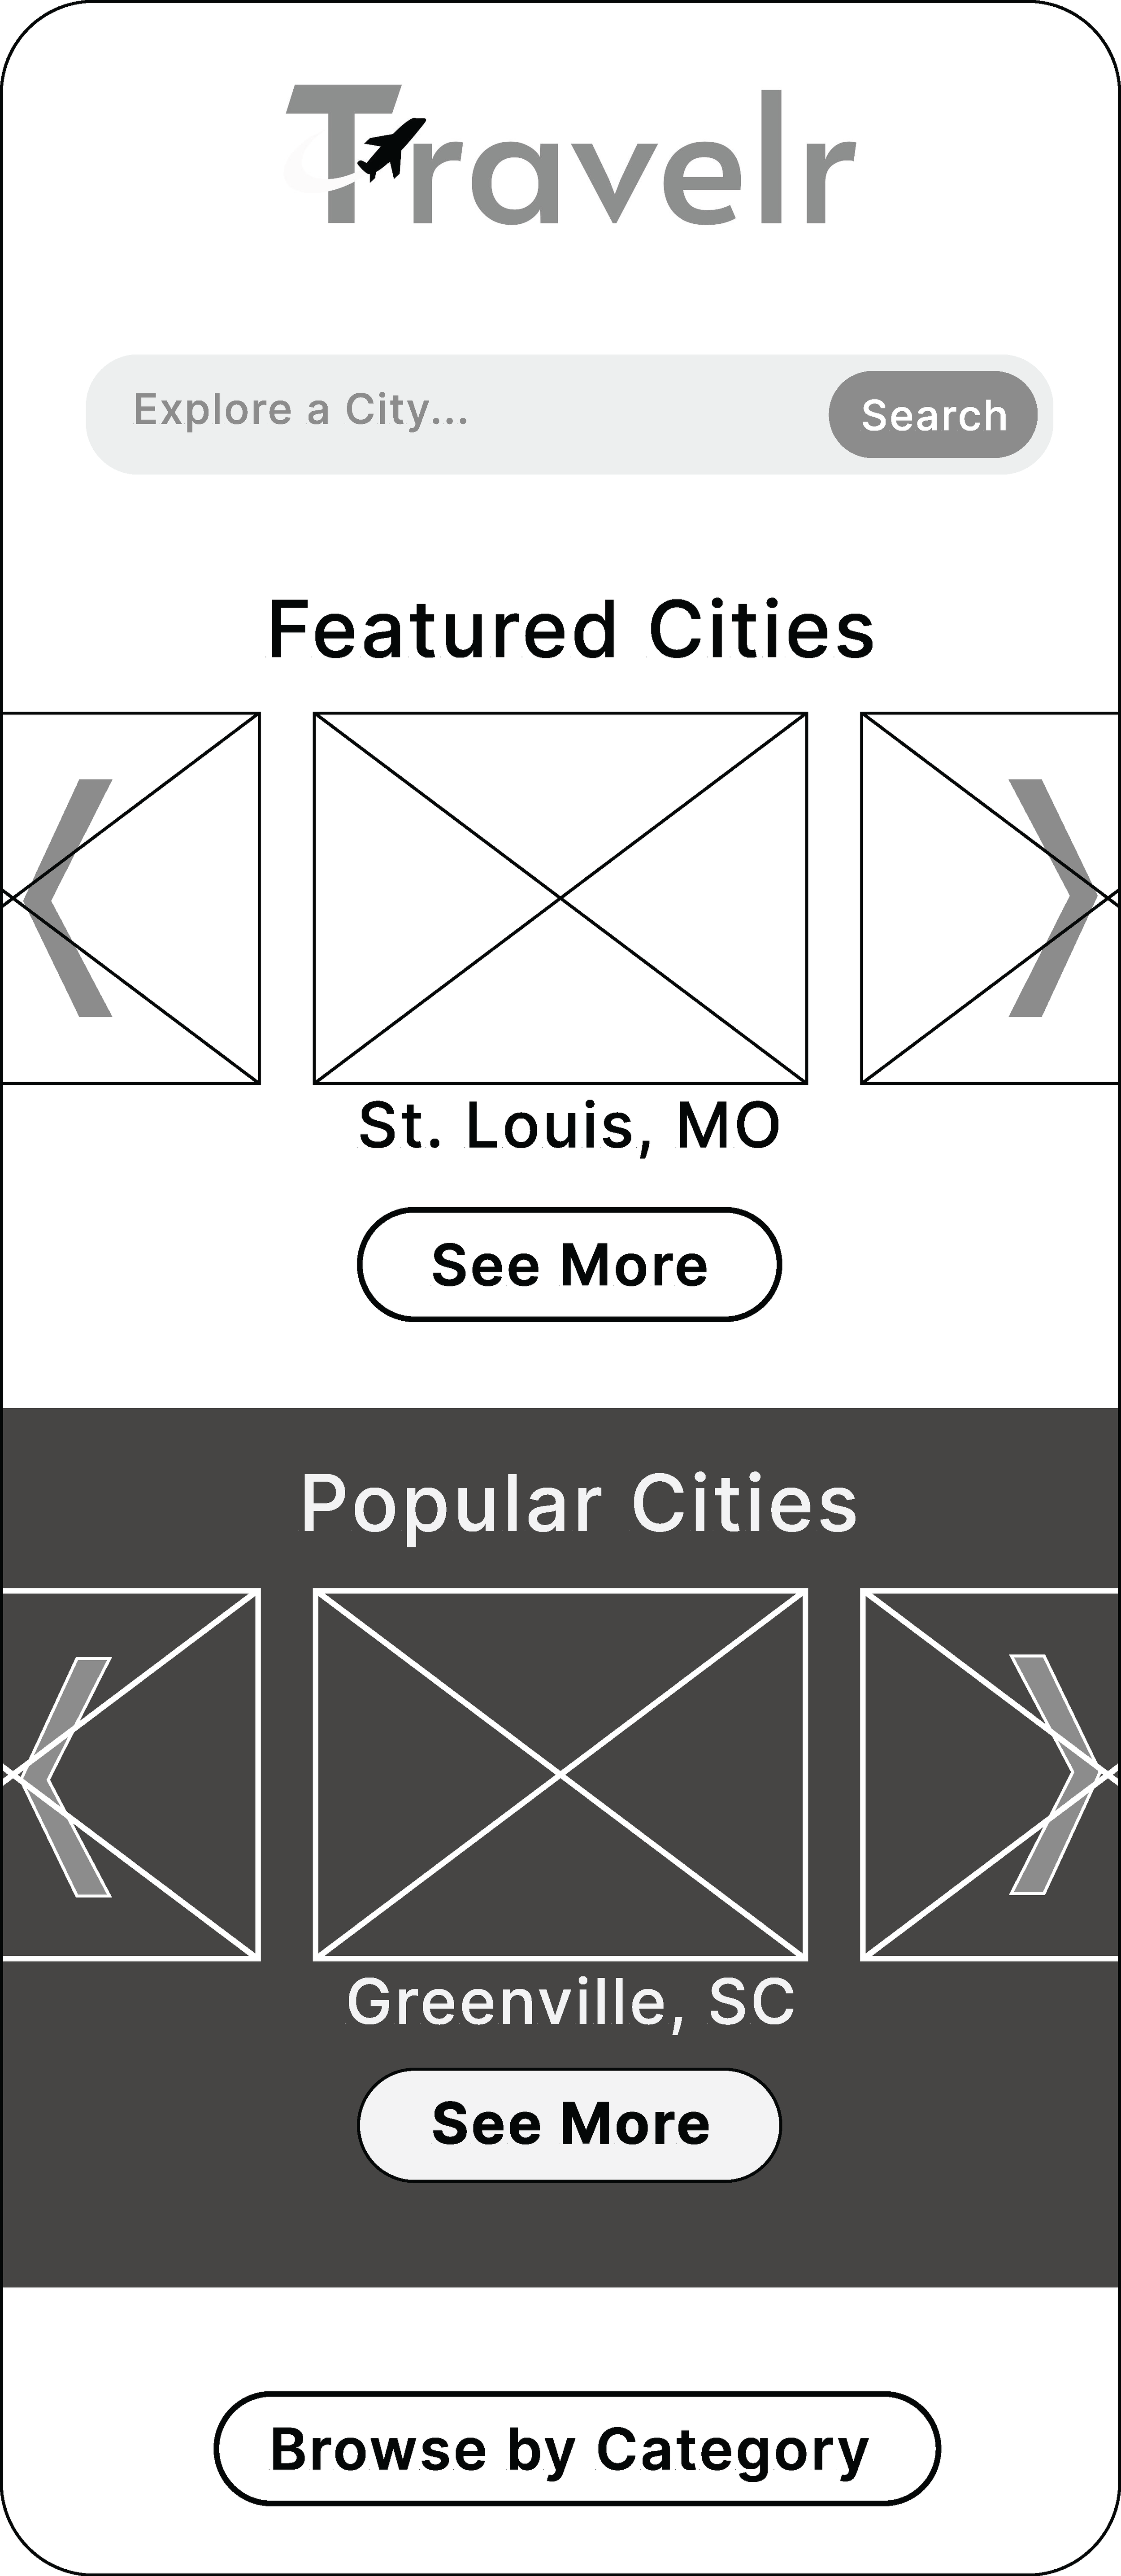
Home Page
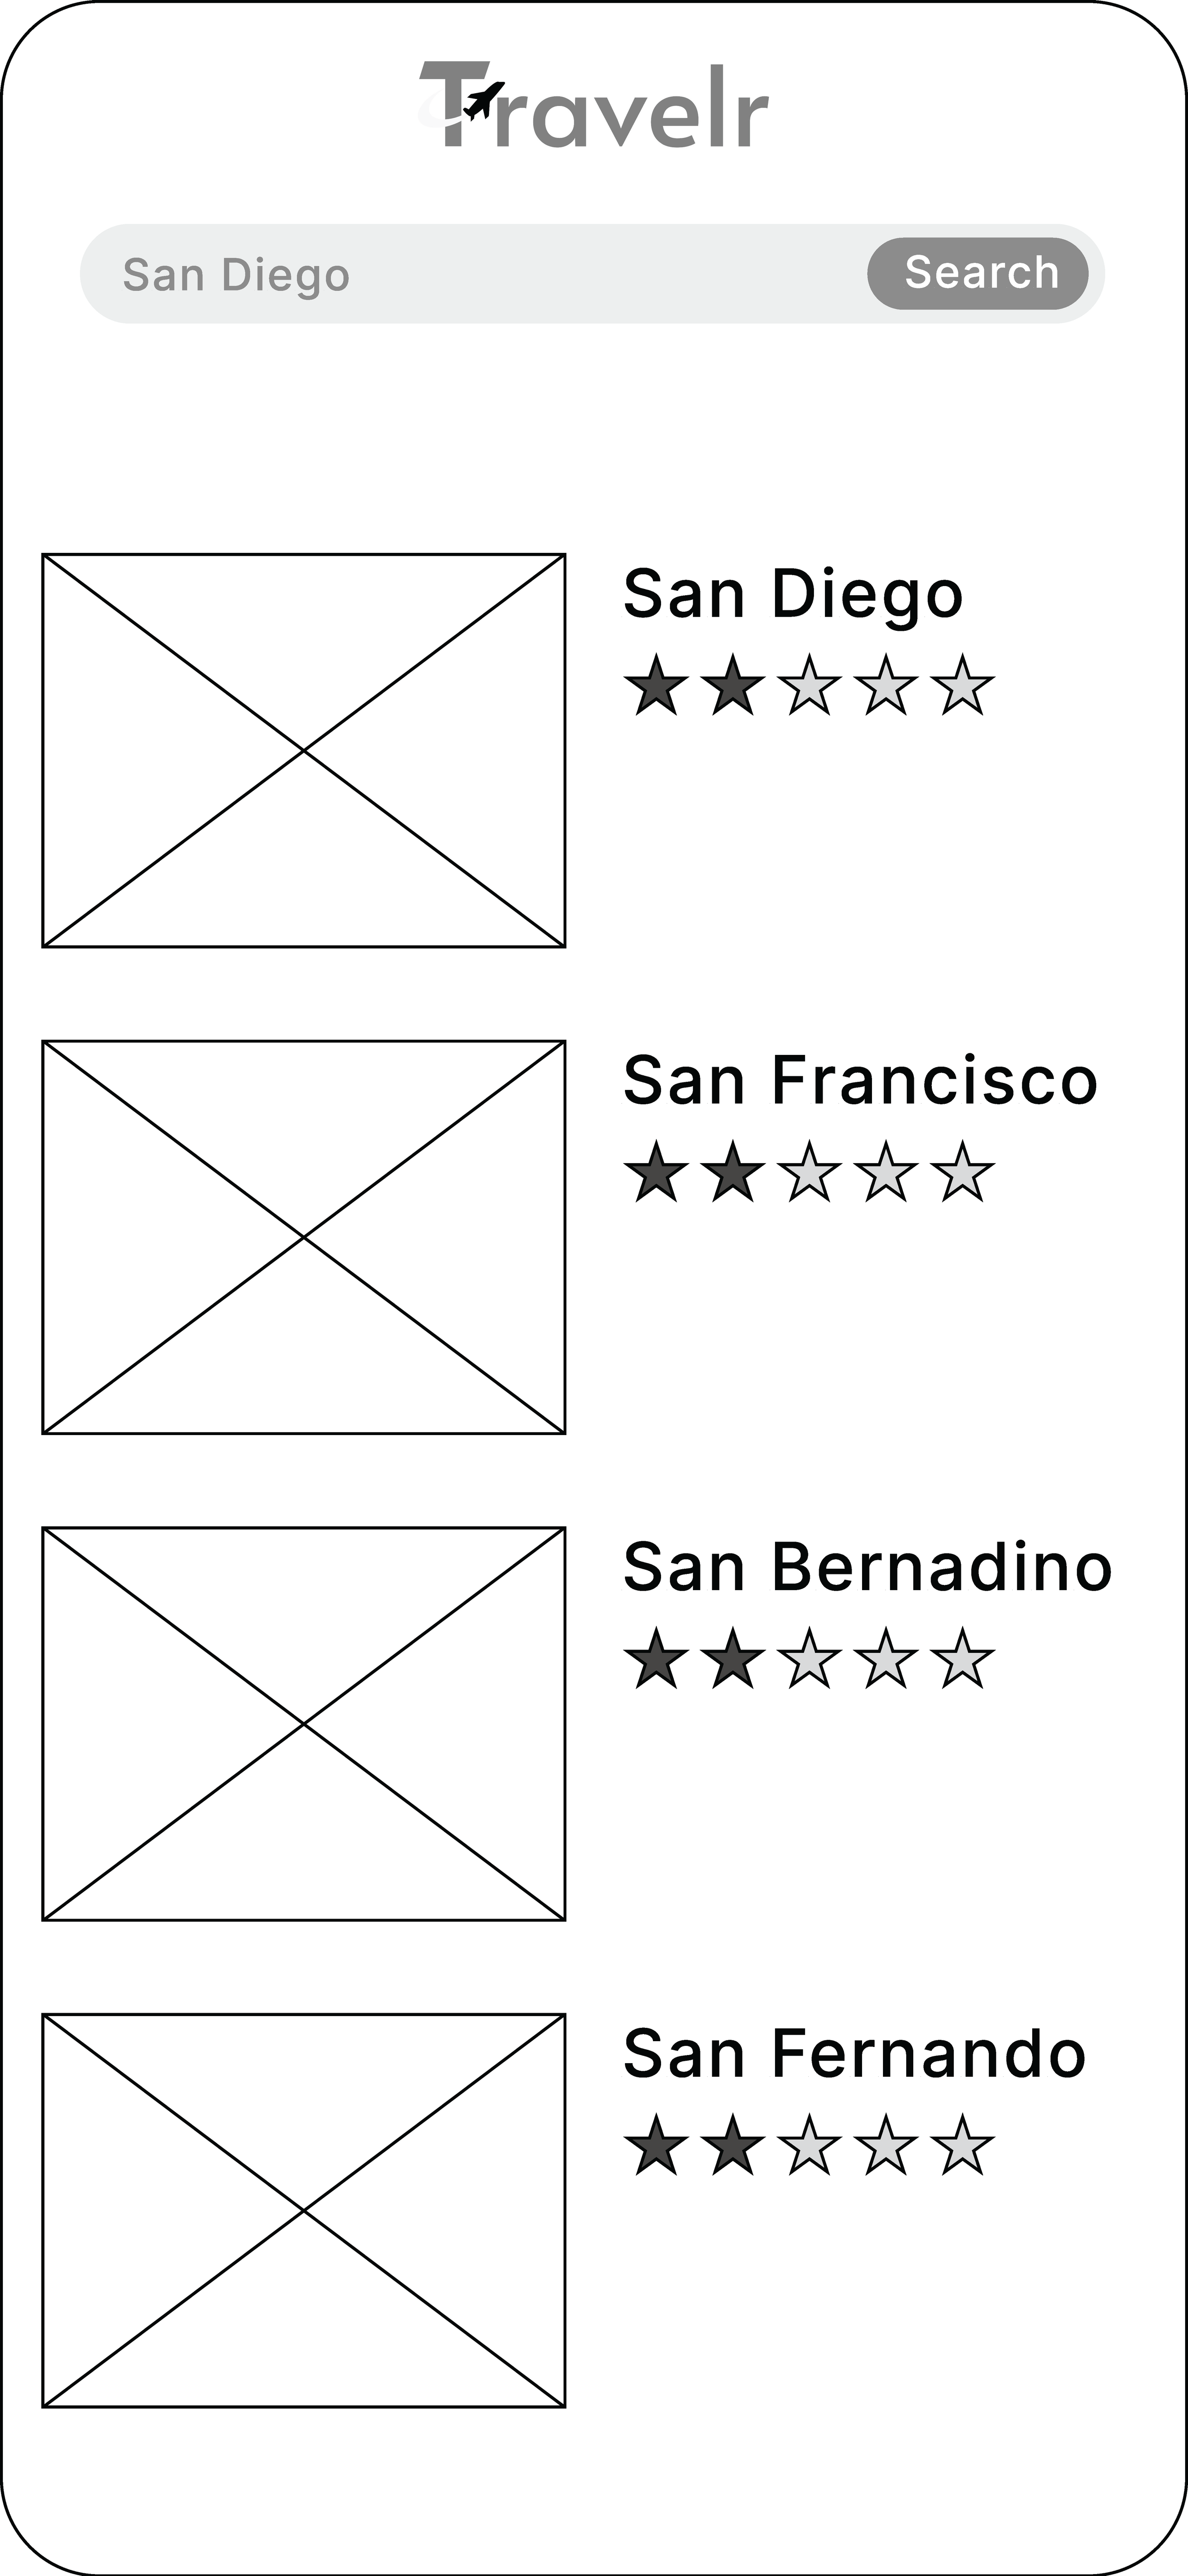
Search Results Page
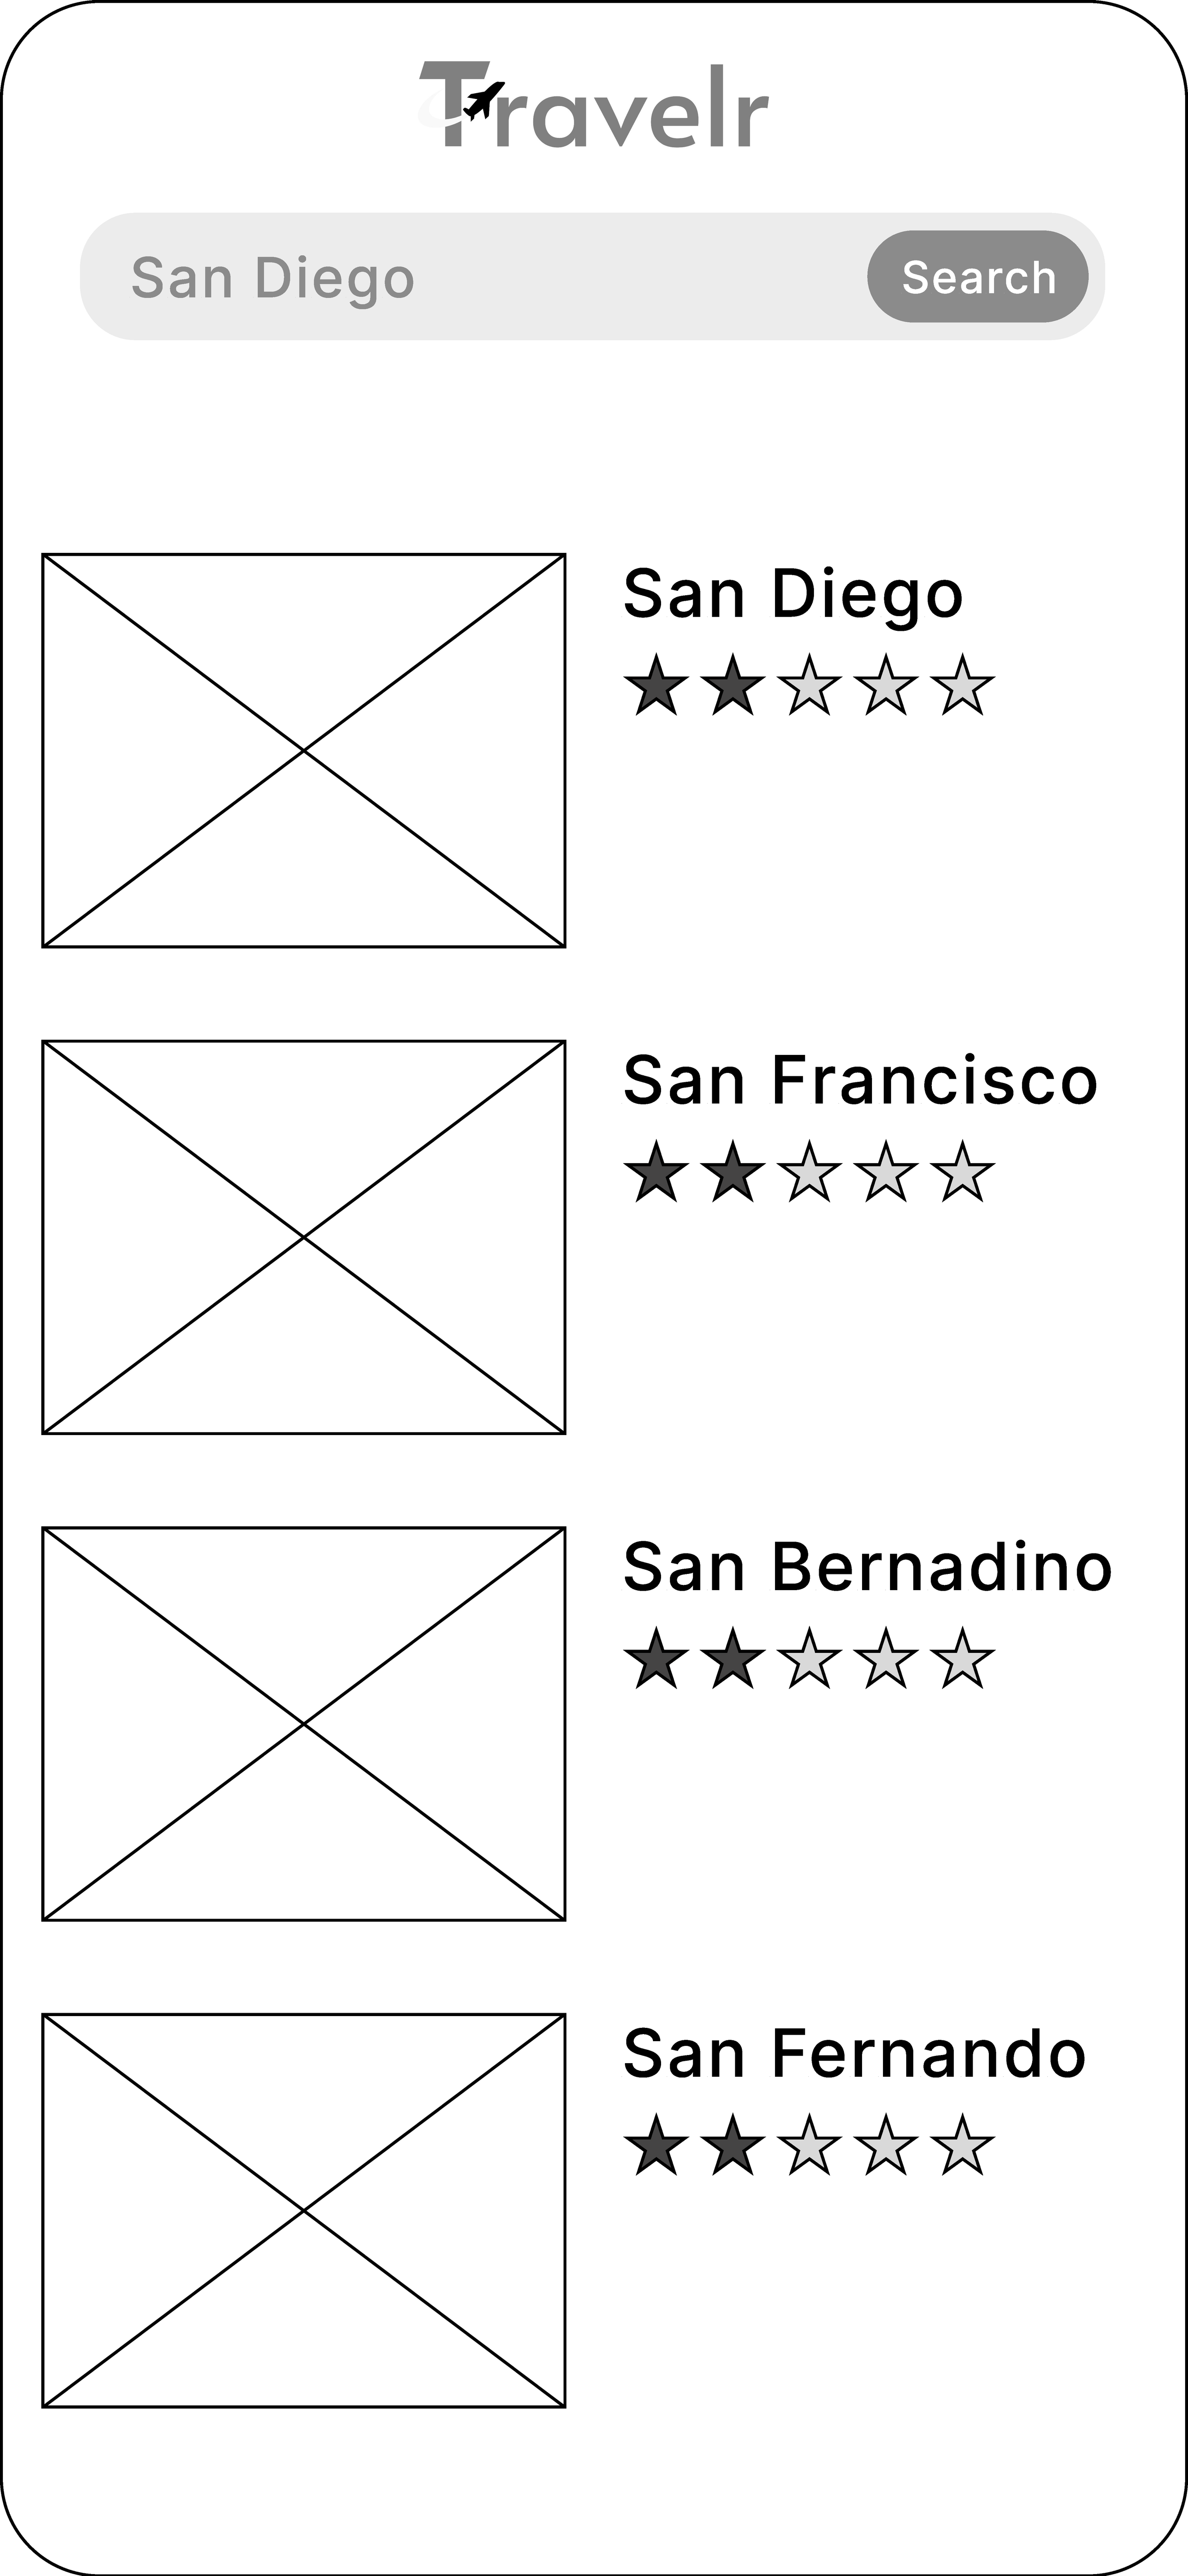
Results Page
City Profile Page
City Profile Page
Browse Categories
Write a Review Page
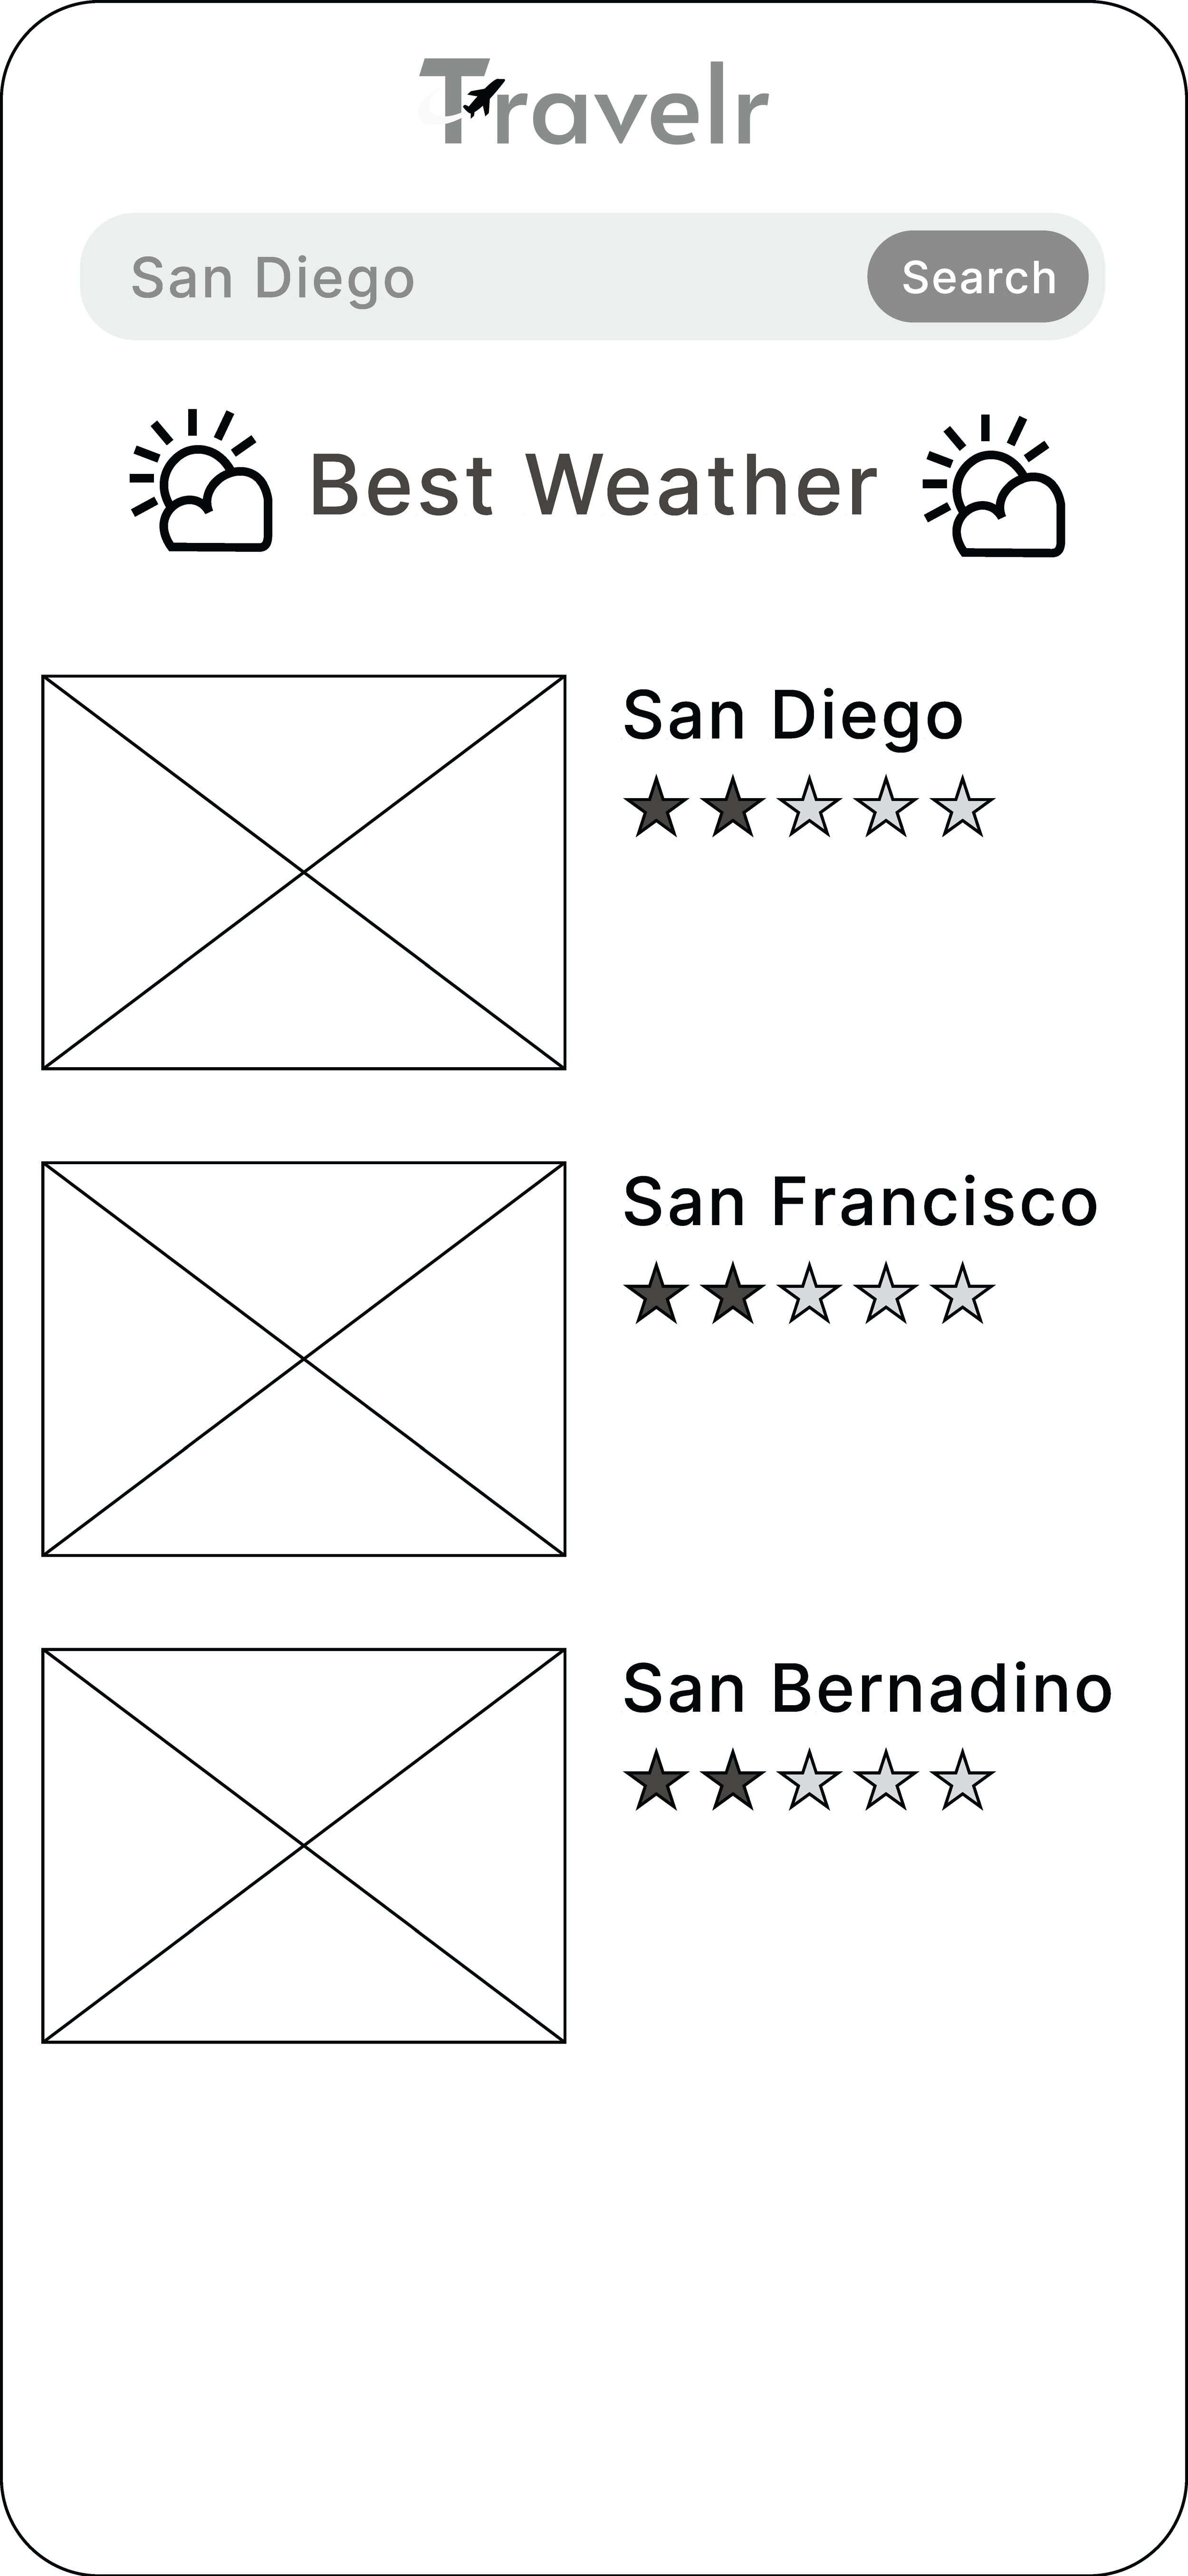
Best Weather Page
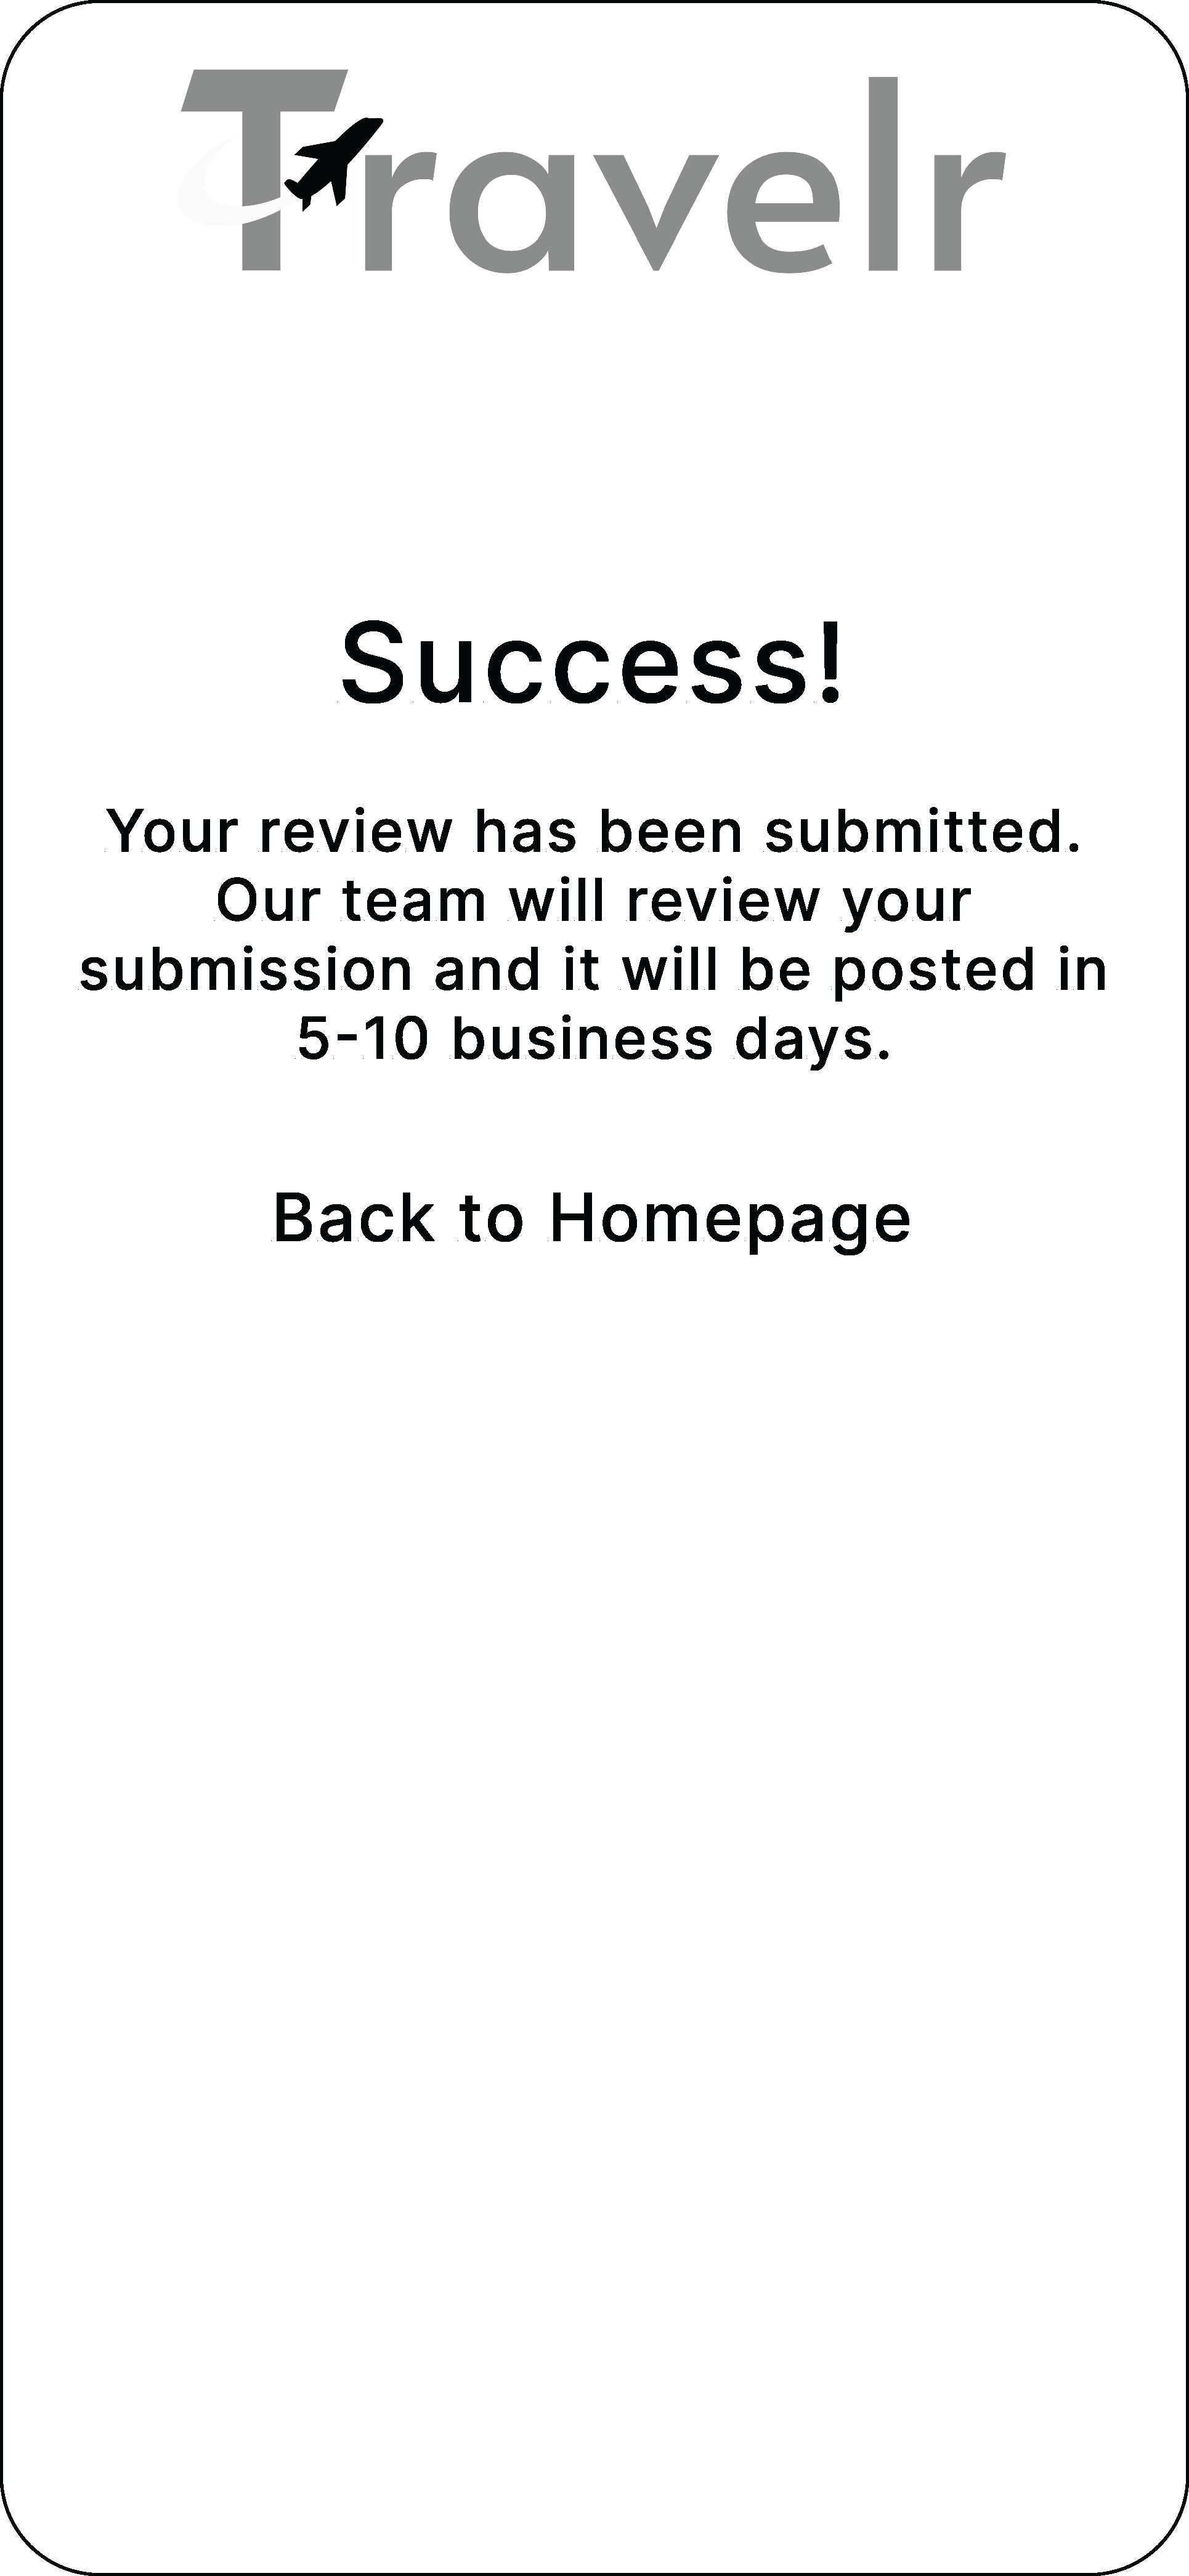
Review Submitted
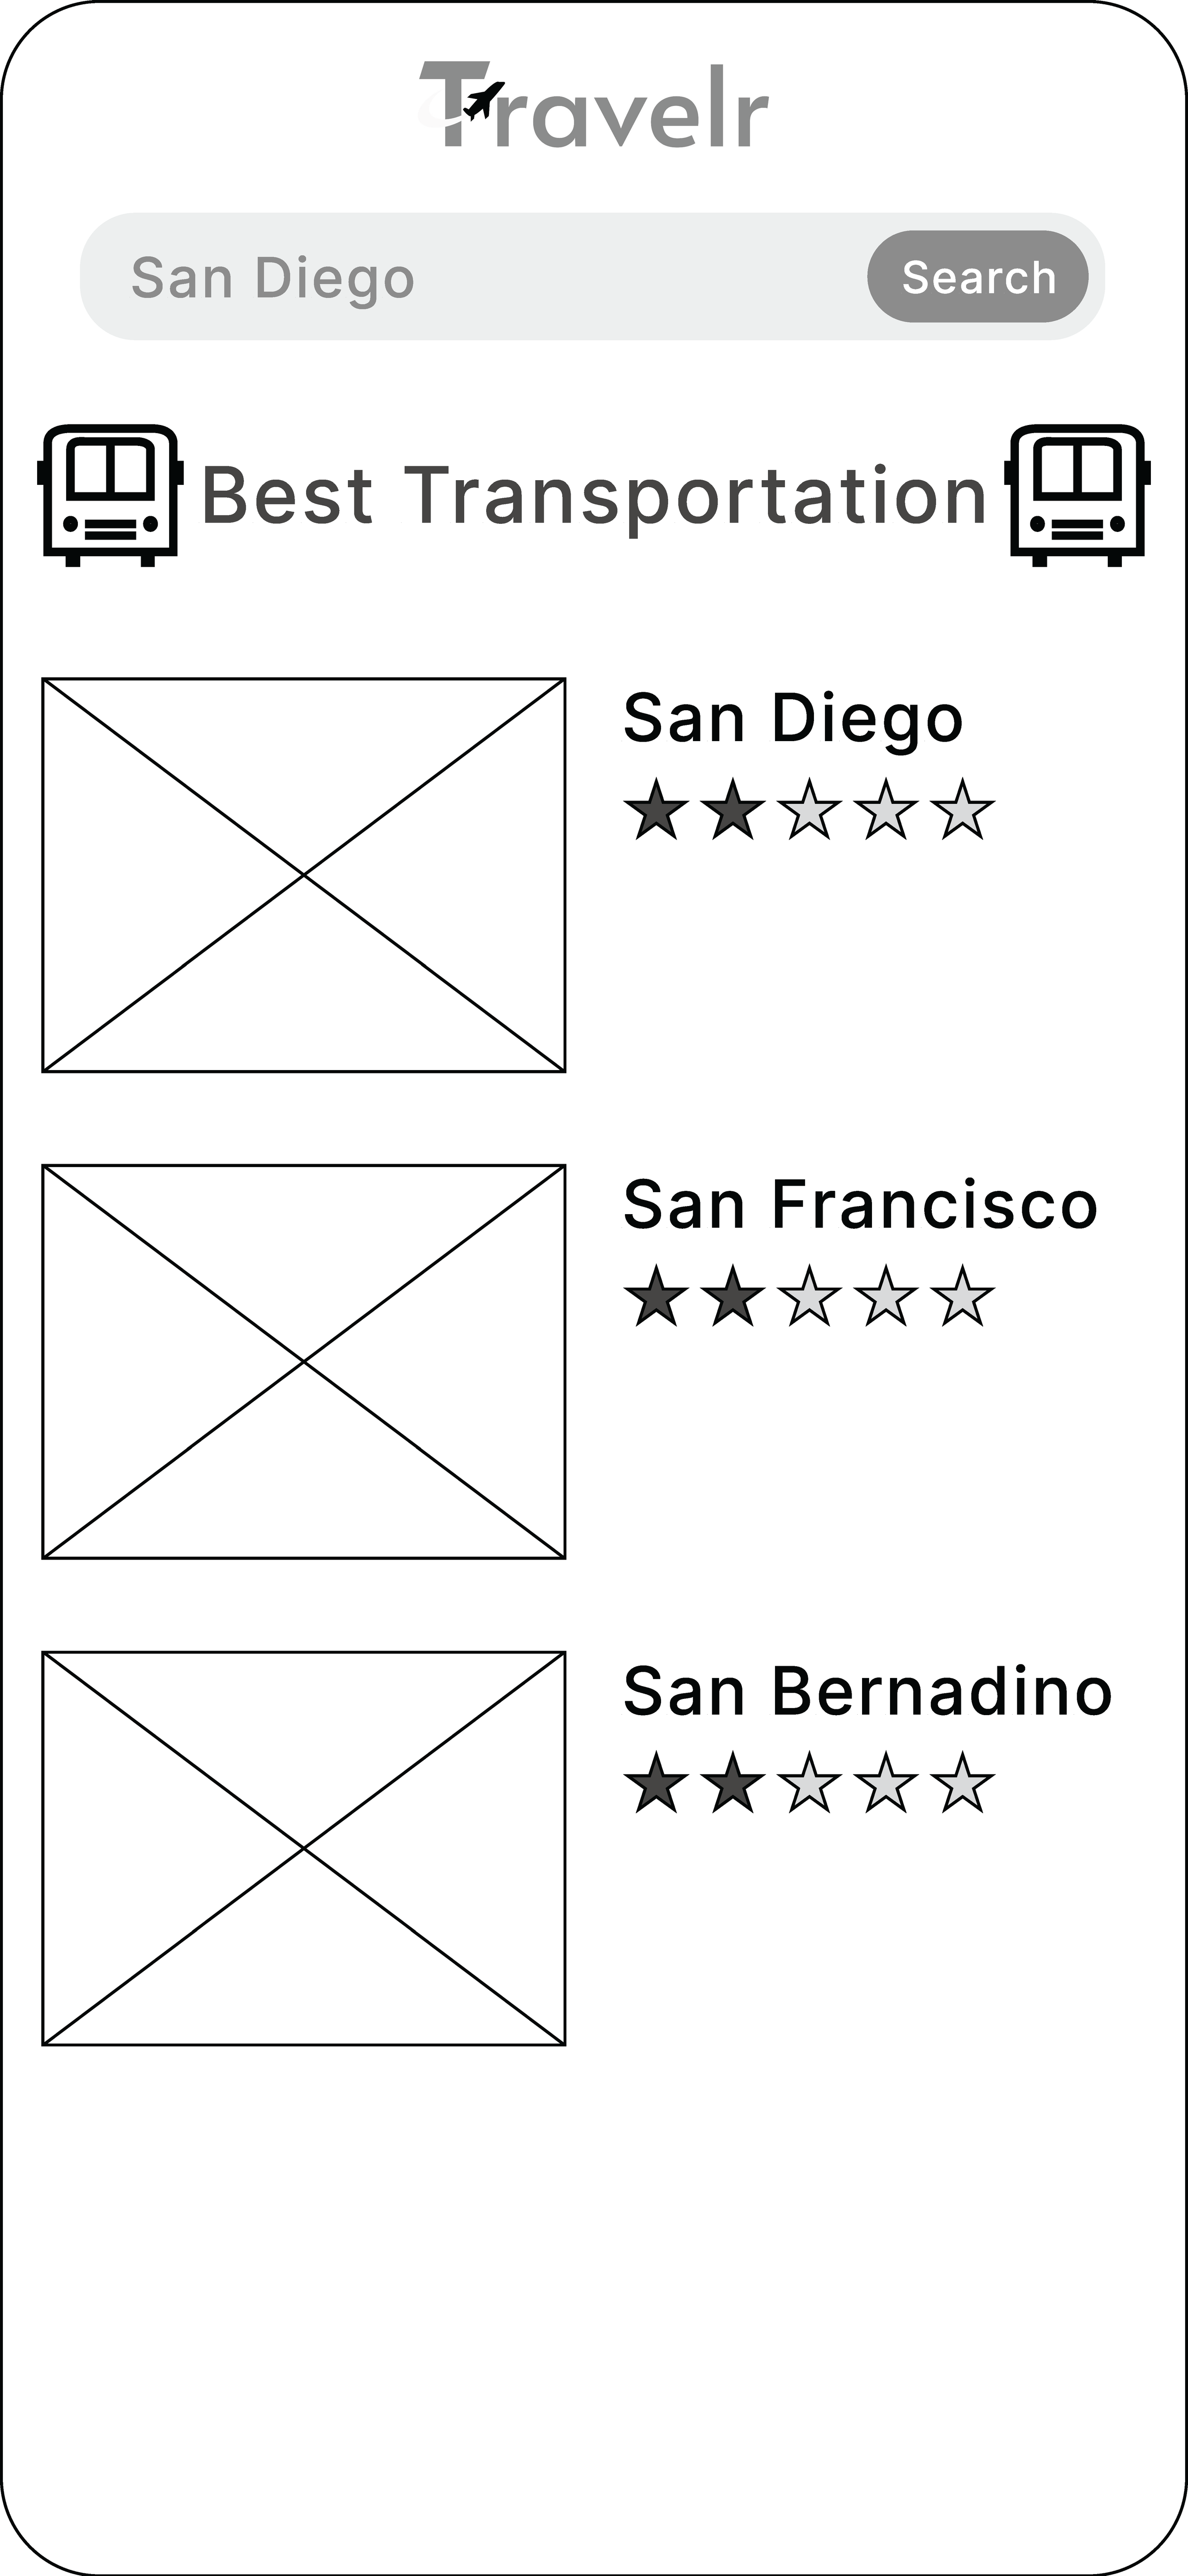
Best Transportation
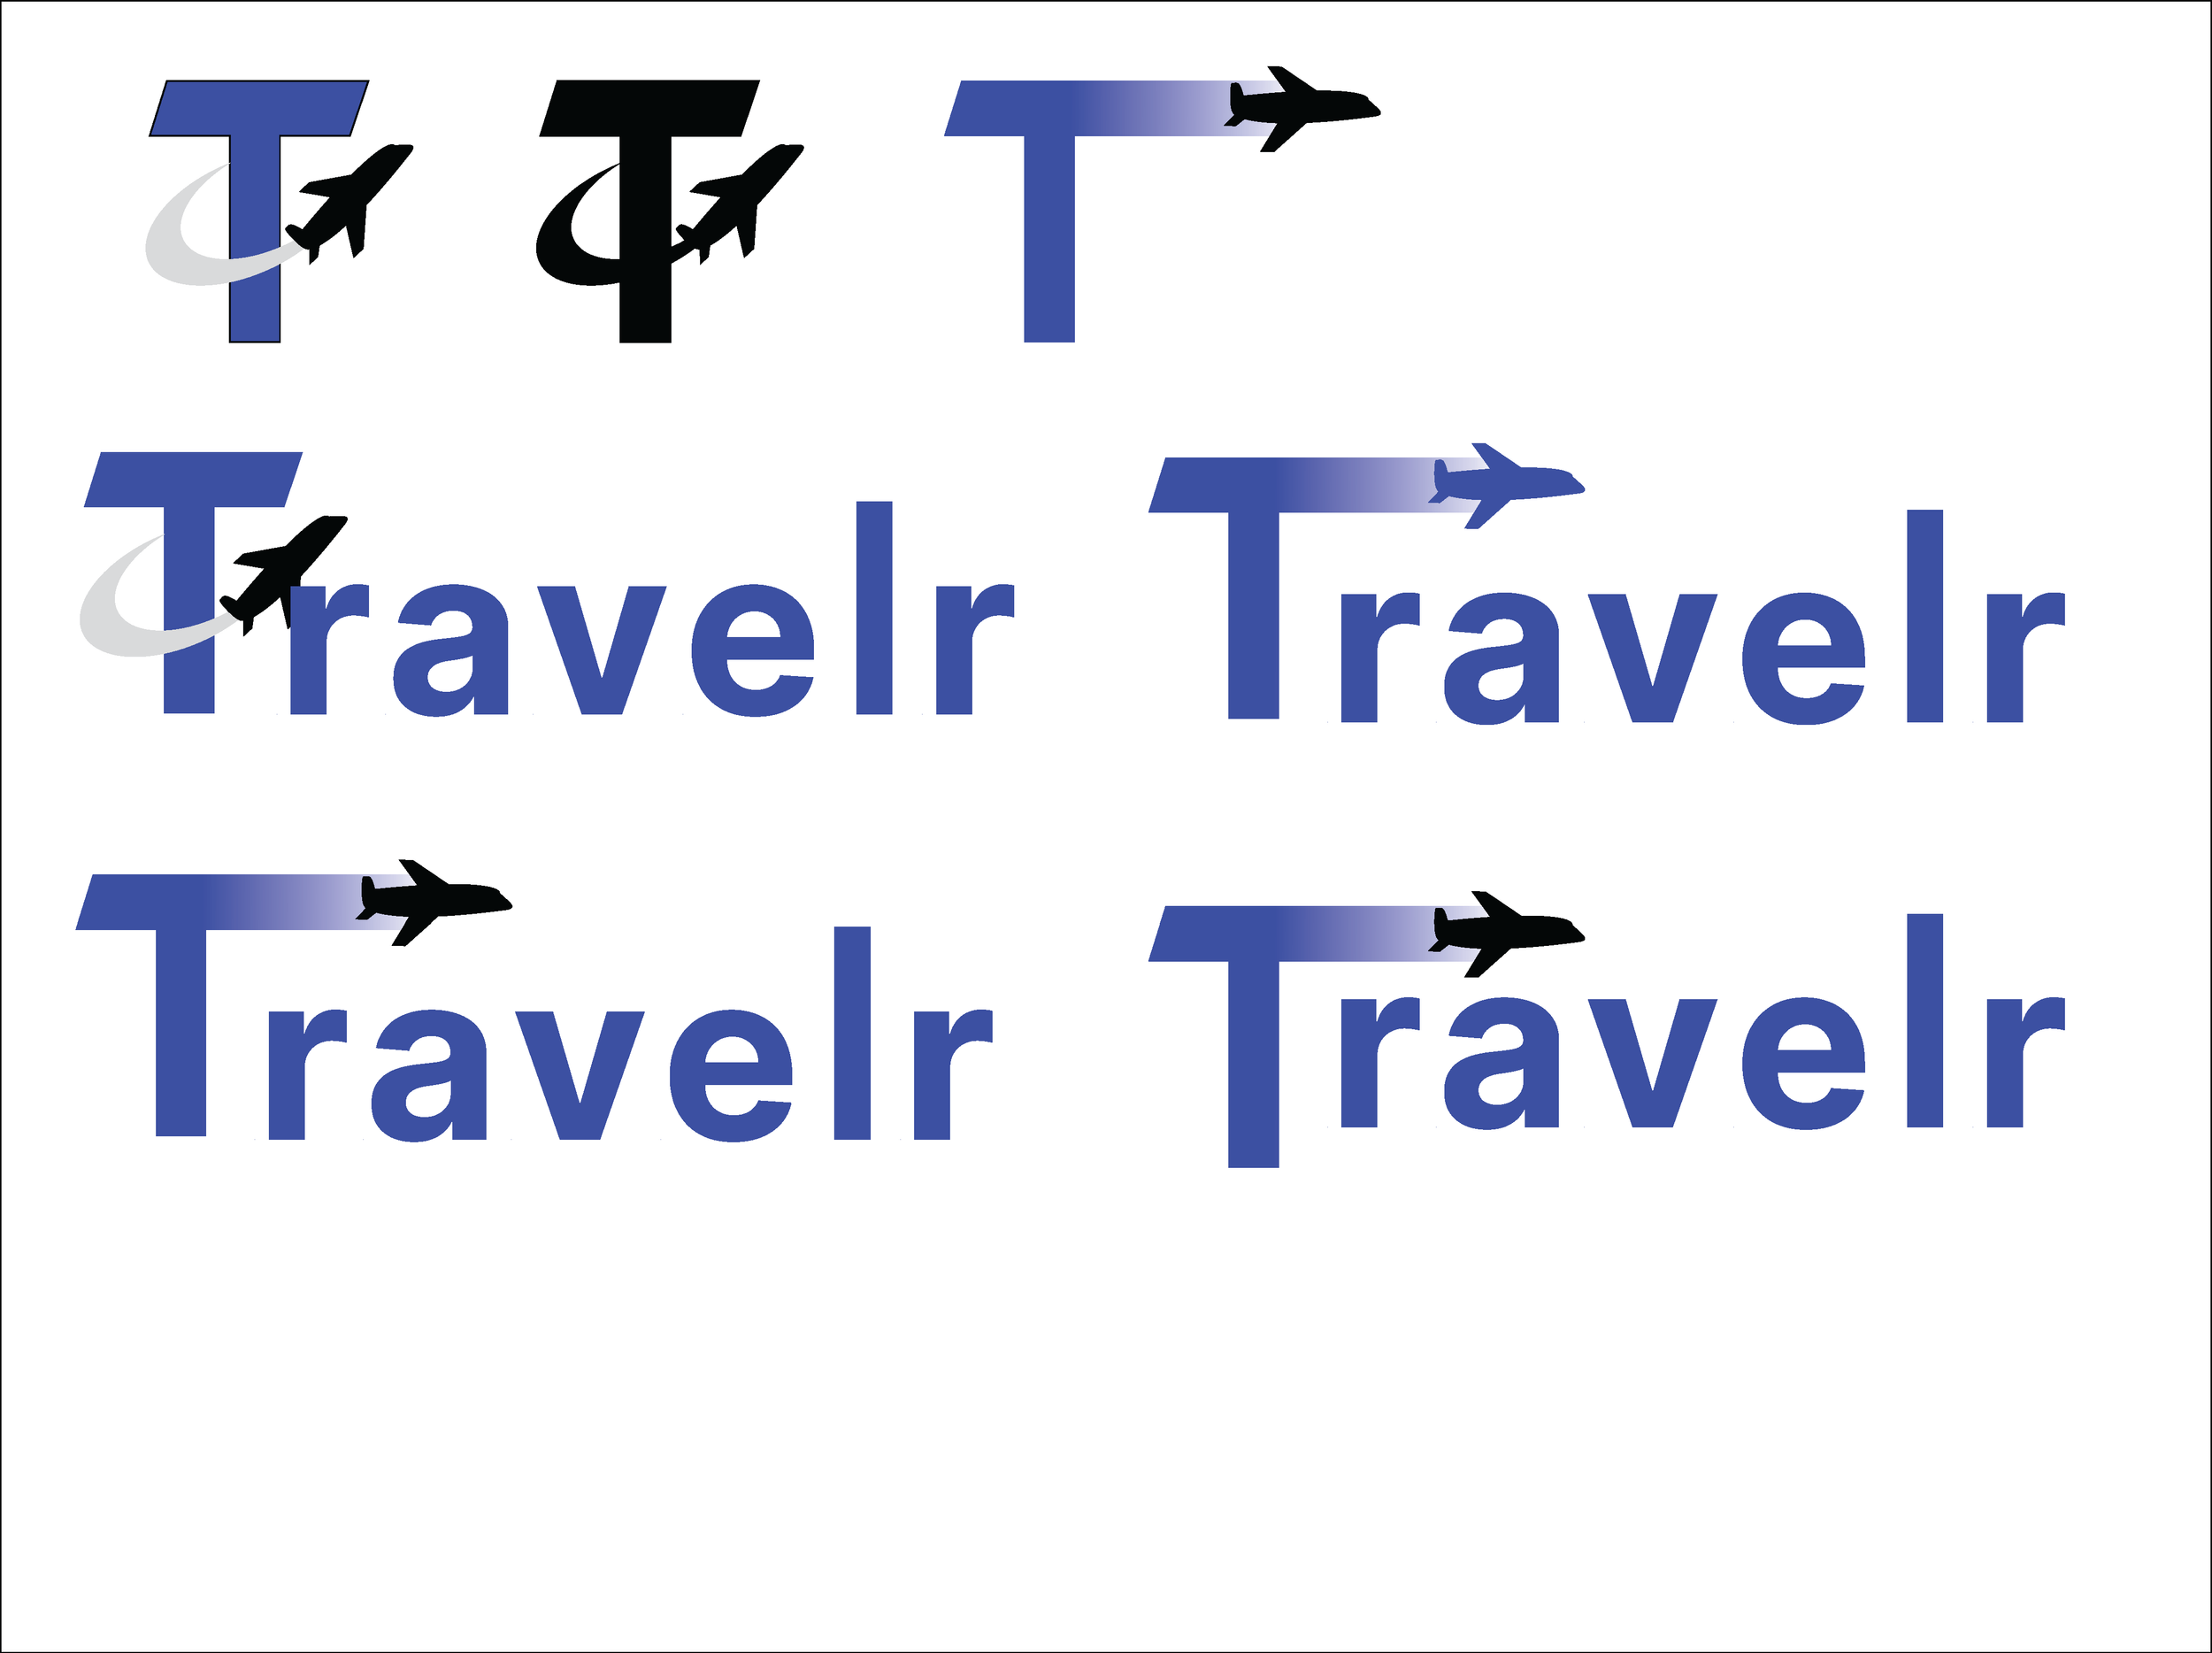
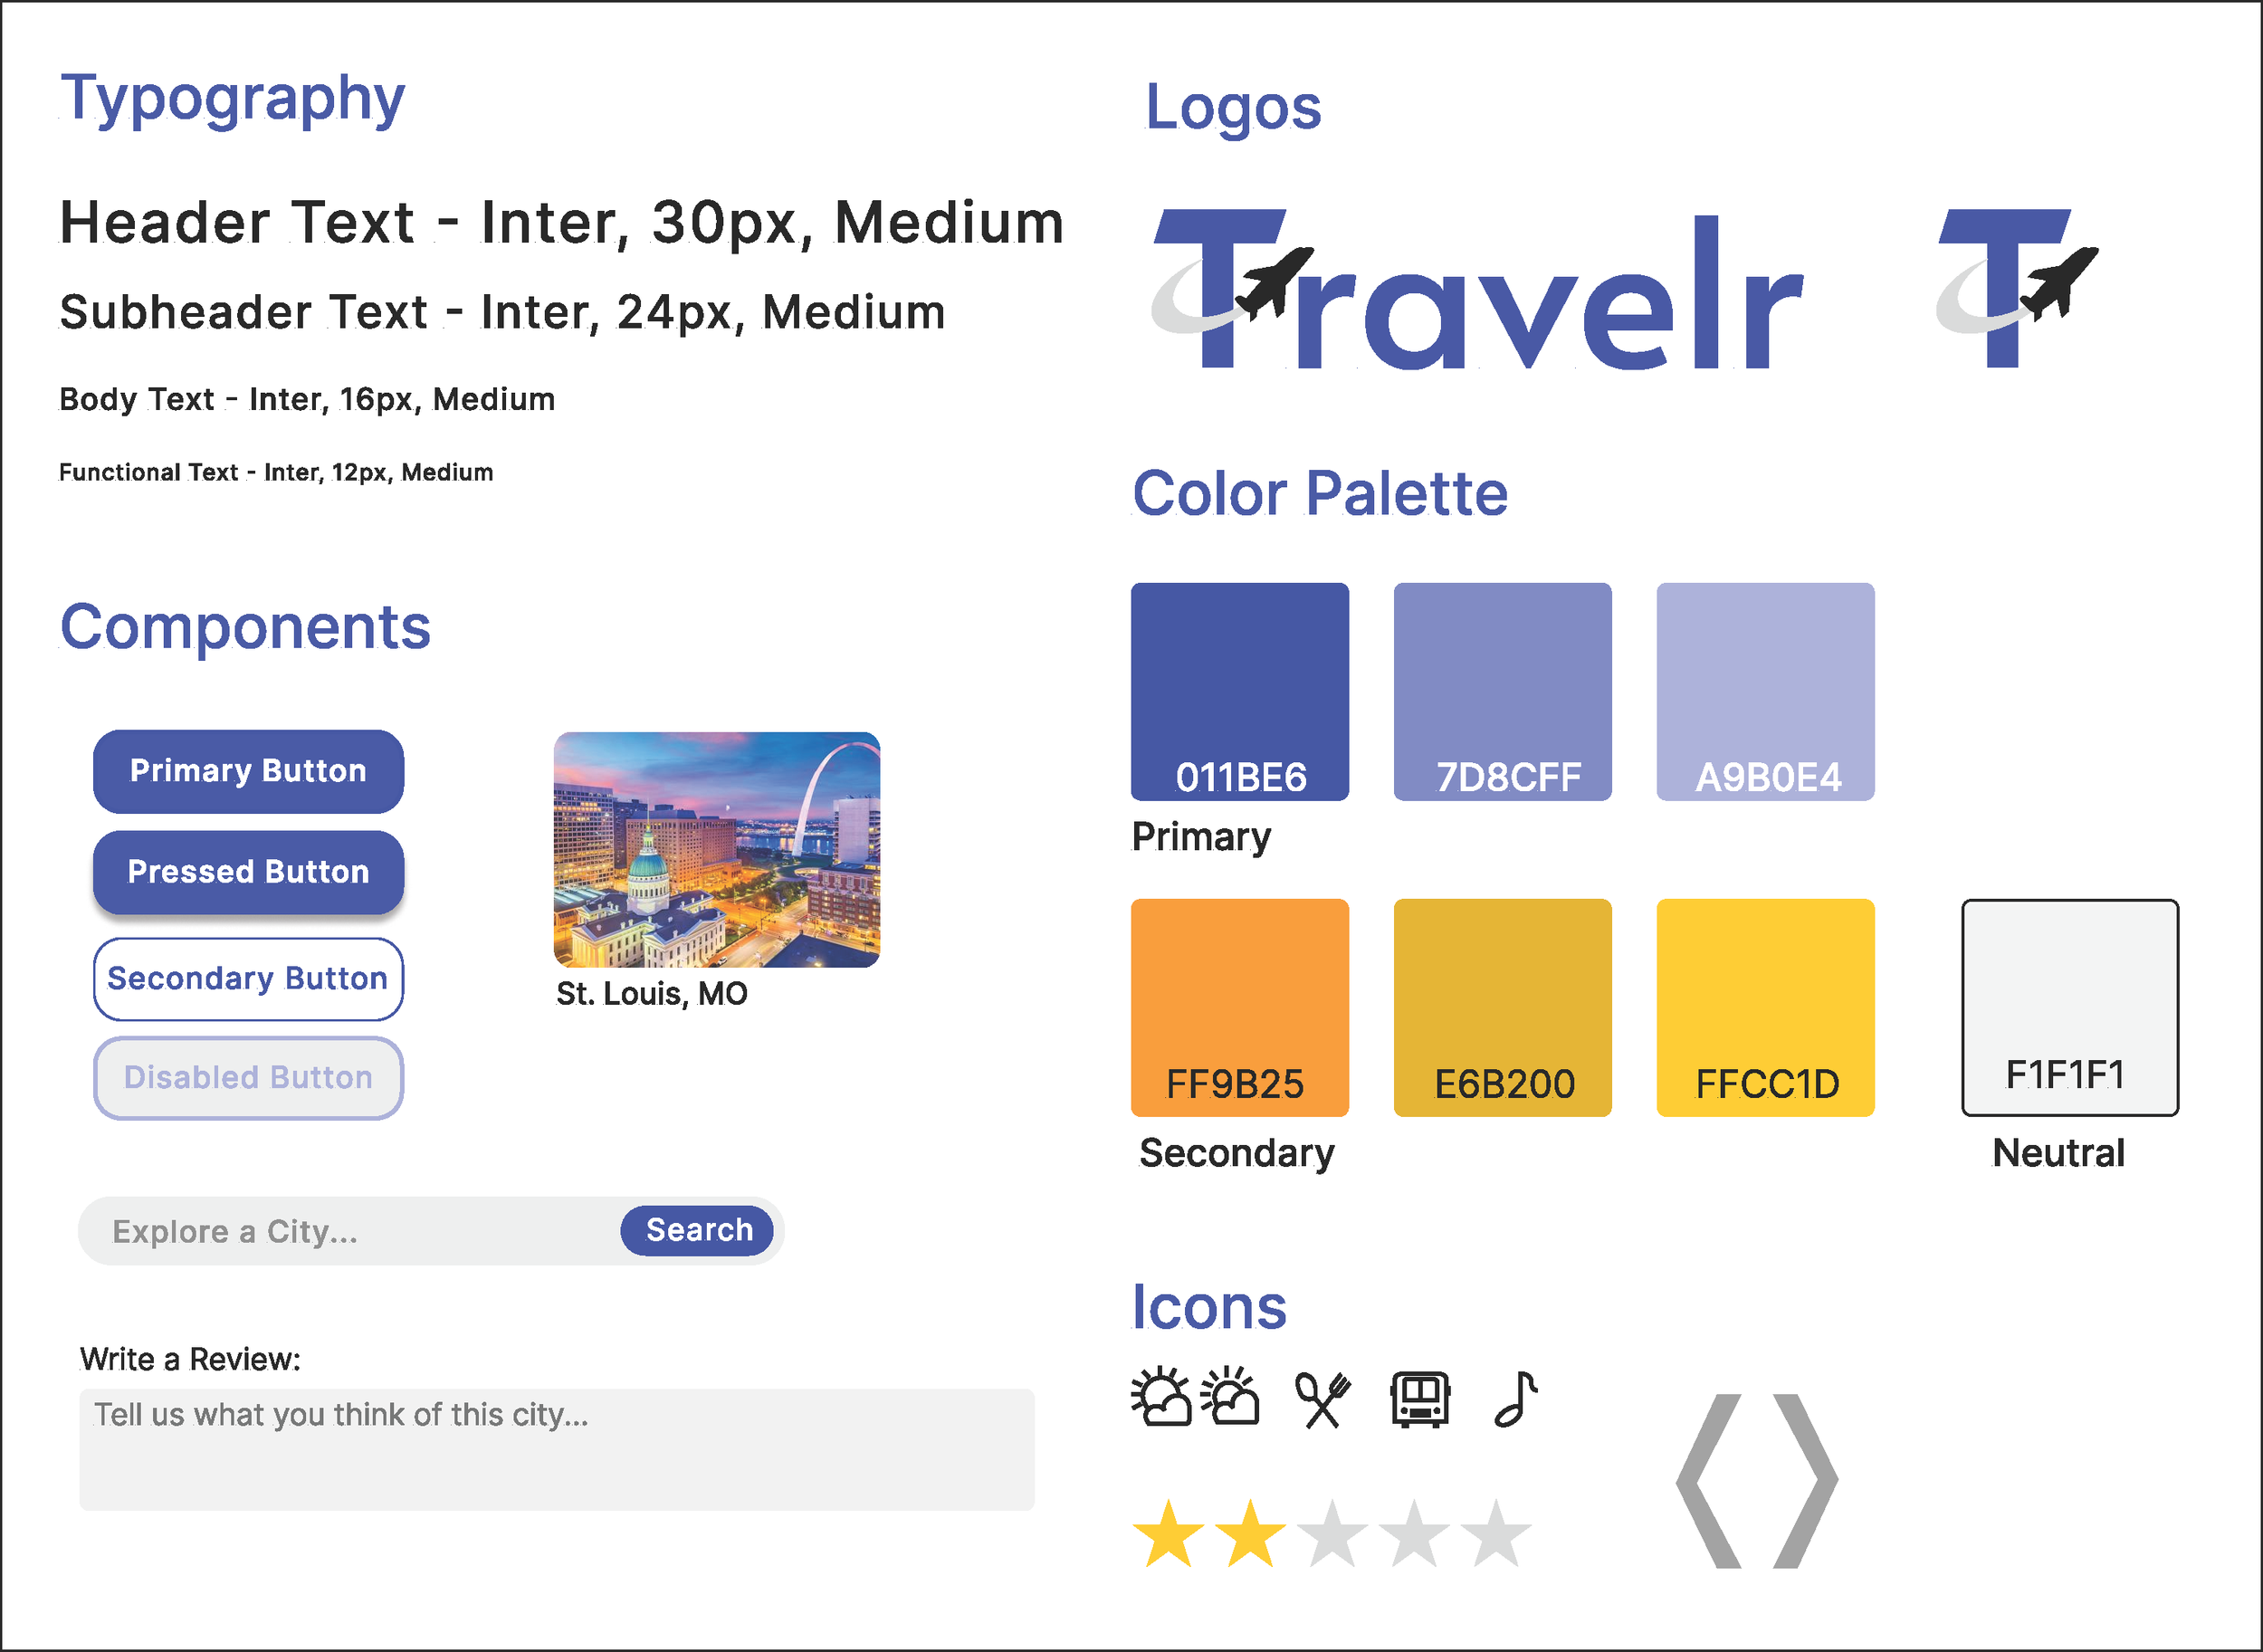
Logo Design
Multiple drafts of the eventual logo
UI Elements
Sample tiles of the colors, fonts, and buttons
Usability Tests
The purpose of these test was to see how quickly and efficiently the participants could accomplish common basic tasks with the current user interface.
Age: 32-38 Gender: 66% Male 34% Female
Testing conducted remotely
Usability Test subjects were asked to accomplish the following three tasks:
Task 1
Find a City Profile Page
Task 2
Browse Top Cities By Category
Task 3
Write a Review for a City
Usability Test Results
User Observations:
Participants navigated the site successfully with very little issue
Stated that the site was “straightforward” and “intuitive”
Users kept clicking the hamburger icon
User Feedback:
Add functionality to the hamburger menu icon
Make categories clickable on city pages
Add pages listing activities in the city
Iterations
Improvements made in response to the feedback from users during the Usability Testing